

Stocks fell in January as several governments imposed stricter lockdowns to combat the COVID-19 pandemic, and amid a trading frenzy in heavily-shorted US shares that raised concerns about systemic risk.
The STOXX® Global 1800 Index dropped 1% in the month when measured in dollars and including dividends.1 Most of the losses took place in the latter days of the month, after the index climbed to a record on Jan. 21. The benchmark slid 0.3% in euros as the greenback gained 0.7% against the common currency.
The Eurozone’s EURO STOXX 50® Index fell 1.8% when measured in euros, while the pan-European STOXX® Europe 600 Index retreated 0.7%. The STOXX® North America 600 Index lost 0.9% in dollars, as did the STOXX® USA 500 Index. The STOXX® Asia/Pacific 600 Index decreased 0.4% in dollars.
The STOXX Global 1800 rose 16.9% last year, its second straight year of double-digit percentage gains, as investors raised expectations that policy support and vaccines will help economies overcome the COVID-19-induced slump.
Exhibit 1 – Returns since 2020
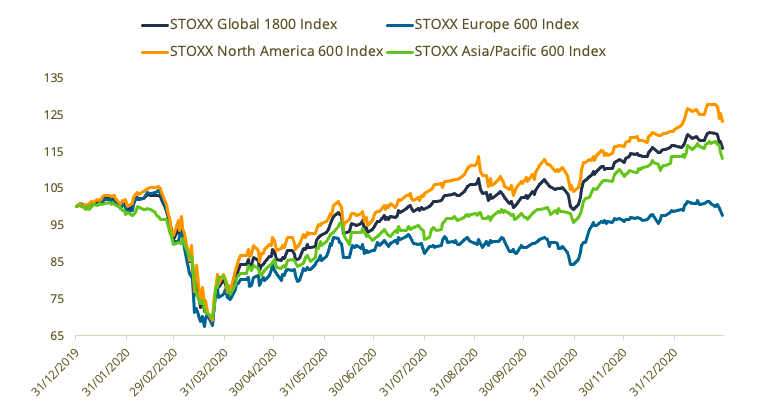
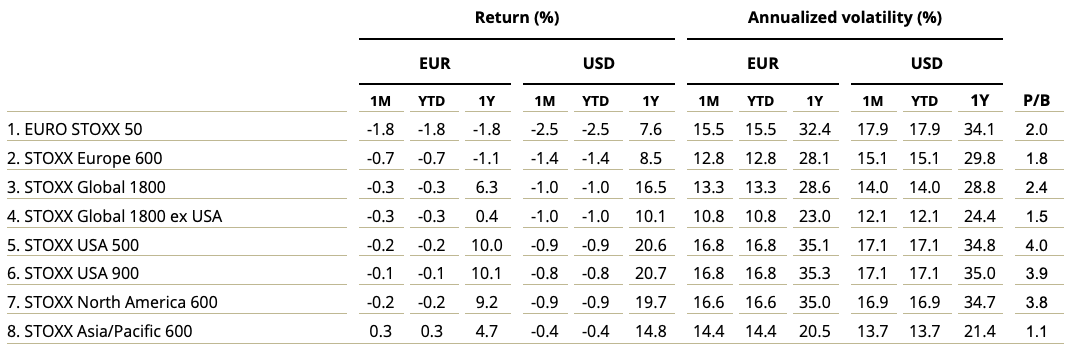
Exhibit 2 – Benchmark indices’ January risk and return characteristics
However, the ongoing battle against the pandemic has caused some investors to tone down their optimism this year. Many countries have had to restrict activity further as COVID-19 infections continue to rise and new variants of the virus emerged. The vaccination roll-out in many places has proved uneven and disappointing, with vaccine supply to many nations falling well short of demand.
Volatility increases
January also saw wild moves in shares such as GameStop Corp. and other companies heavily shorted by hedge funds. The stocks reportedly surged as retail traders piled in following discussions on online bulletin boards and social media forums.2 The share-price increase stoked fears that hedge funds would need to unwind other positions to cover losses in their shorts, eventually triggering pullbacks in other shares and markets.
The EURO STOXX 50® Volatility (VSTOXX®) Index rose to 29 from 23.4 in December. The volatility gauge, which tracks EURO STOXX 50 options prices, touched a high of 86 in March 2020, when the pandemic became widespread. A higher reading suggests investors are paying up for puts that offer insurance against stock price drops.
Mixed picture across national markets
Seventeen of 25 developed markets tracked by STOXX dropped during January when measured in dollars. The STOXX® Ireland Total Market Index led losses, falling 4.6%. The STOXX® Developed Markets 2400 Index slid 0.8% in dollars and 0.1% in euro terms. In 2020 it gained 17% and 7.4%, respectively.
Twelve of the 21 national developing markets tracked by STOXX fell in the month. The STOXX® Colombia Total Market Index was the worst performer for a second month in a row, slumping 10.2%. The STOXX® Emerging Markets 1500 Index was little changed in dollars in January and added 0.7% in euros, after climbing 11.9% and 2.7% respectively in 2020.
Sixteen of the 20 Supersectors in the STOXX Global 1800 Index fell in the month, led by a 5.7% decline in the STOXX® Global 1800 Travel & Leisure Index. The STOXX® Global 1800 Automobiles & Parts Indexand the STOXX® Global 1800 Energy Index were January’s best performers. They rose, respectively, 4.3% and 2.5%.
Factor-based strategies
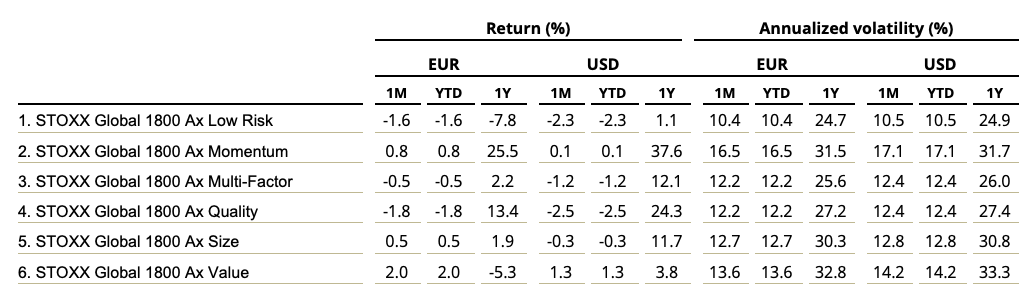
The STOXX Factor Indices show investors flocked to Value stocks, while snubbing those that rank high in the Quality and Low Risk styles. The STOXX® Global 1800 Ax Value Index, for example, added 1.3% in January (Exhibit 3).
Exhibit 3 – STOXX Factor indices’ January risk and return characteristics
In Europe, it was Size that provided the standout performance in January, with the STOXX® Europe 600 Ax Size Index adding 1.4% in euros. The STOXX® Europe 600 Ax Low Risk Index, which posted the group’s second-steepest loss during 2020, retreated 1.7% in the month.
Value reigned among US factors in the month that ended. The STOXX® USA 500 Ax Value Index rose 1.7%, while the STOXX® USA 900 Ax Value Index added 2.2%.
Factor Market Neutral Indices
All but one — Carry — of the seven iSTOXX® Europe Factor Market Neutral Indices had a positive return during January. The indices hold a short position in STOXX Europe 600 futures to help investors neutralize systematic risk. Size was the best-performing strategy for a second consecutive month. The iSTOXX® Europe Size Factor Market Neutral Index jumped 3.3% on a net-return basis.
Minimum variance strategies continued to underperform as investors broadly snubbed low-risk stocks. The STOXX® Global 1800 Minimum Variance Index lost 2.5% during the month and the STOXX® Global 1800 Minimum Variance Unconstrained Index slipped 1.4%. The STOXX® Europe 600 Minimum Variance Index retreated 1.8% in euros, while its unconstrained version decreased 1.2%.
The STOXX® Minimum Variance Indices come in two versions. A constrained version has a similar exposure to its market-capitalization-weighted benchmark but with lower risk. The unconstrained iteration, on the other hand, has more freedom to fulfill its minimum variance mandate within the same universe of stocks.
Sustainability indices
The STOXX® ESG-X indices performed slightly better than benchmarks during January, generally speaking. The indices are versions of traditional, market-capitalization-weighted benchmarks that observe standard responsible exclusions of leading asset owners.
The STOXX® Global 1800 ESG-X Index retreated 0.9% in dollars and the STOXX® Europe 600 ESG-X Index fell 0.6% in euros.
Within indices that combine exclusions and ESG integration, the EURO STOXX 50® ESG Index outperformed its benchmark by 44 basis points during the month. The ESG index, which is derived from the iconic EURO STOXX 50 Index, beat its benchmark by more than 3 percentage points in 2020.
The DAX® 50 ESG Index, which excludes companies involved in controversial activities from a sustainability point of view and integrates ESG scoring into stock selection, outperformed the DAX® by 28 basis points.
Climate benchmarks
The STOXX Paris-Aligned Benchmark Indices (PABs) and the STOXX Climate Transition Benchmark Indices (CTBs) underperformed during January, possibly as a result of the strong returns in the Energy and Automobiles sectors. The indices were introduced last year and follow the requirements outlined by the European Commission’s Technical Expert Group (TEG) on climate benchmarks.
The EURO STOXX 50® Low Carbon Index lagged its benchmark by 41 basis points during January, while the STOXX® Europe 600 Low Carbon Index underperformed by 17 basis points.
Thematic indices
The STOXX® Thematic Indices continued to show strong outperformance as the strategies rightly captured the economic upside of disruptive global megatrends. The indices follow two approaches: revenue-based and artificial-intelligence-driven.
Seventeen of 22 revenue-based thematic indices outperformed the STOXX Global 1800 Index during the month that ended. The STOXX® Global Smart Cities Index, the group’s best performer in 2020, also had the highest returns last month. At the other end, the STOXX® Global Fintech Index fell 6.3%. The average 2020 return for all 22 indices was +35%, more than double that of the benchmark STOXX Global 1800 Index.
Among the STOXX artificial-intelligence-driven thematic indices, the AI theme was a strong performer, with the STOXX® AI Global Artificial Intelligence Index rising 1.5%.
Dividend strategies
Most dividend strategies tracked by STOXX outperformed for a third straight month. The STOXX® Global Maximum Dividend 40 Index, which selects the highest-dividend-yielding stocks, beat the STOXX Global 1800 Index by 1.3 percentage points during January.3
The STOXX® Global Select Dividend 100 Index, which tracks companies with sizeable dividends but also applies a quality filter such as a history of stable payments, topped the benchmark by 9 basis points.
Still, it was the STOXX® Global Select 100 EUR Index that did best, beating the benchmark by more than 1.7 percentage points in euros.4 The index blends increasing dividend yields with low volatility, and was a strong underperformer in recent months.
Dividend strategies were overall very weak performers in 2020.
1 All results are total returns before taxes unless specified.
2 See WSJ, ‘GameStop Stock, Reddit and Robinhood: What You Need to Know,’ Jan. 29, 2021.
3 STOXX Maximum Dividend 40 Index is calculated in net returns.
4 This index is measured in euros.


