

Stocks rebounded strongly from their September losses during October, as companies reported broadly better-than-expected third-quarter earnings despite higher input prices and supply-chain issues.
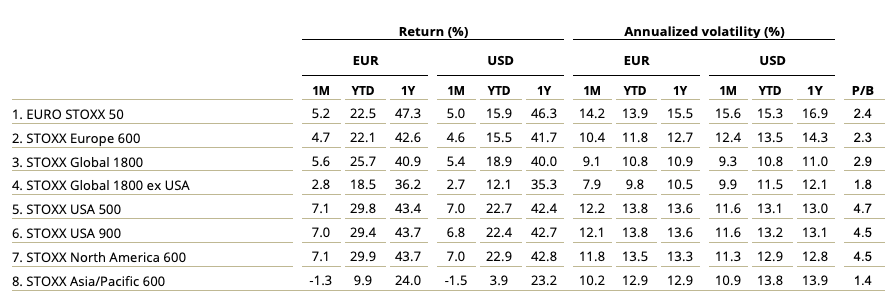
The STOXX® Global 1800 Index jumped 5.4% when measured in dollars and including dividends, its best monthly showing since November 2020.1 The index climbed 5.6% in euros. The benchmark is up 18.9% in dollars this year.
The pan-European STOXX® Europe 600 Index rose 4.7% in euros to a record during the month, while the Eurozone’s EURO STOXX 50 Index increased 5.2%.2 The STOXX® North America 600 Index surged 7% in dollars, also its strongest monthly advance in eleven months. The STOXX® Asia/Pacific 600 Index bucked the trend by falling 1.5%, hurt by pull-backs in Japan and South Korea.
Figure 1 – Benchmark indices’ October risk and return characteristics
| For a complete review of all indices’ performance last month, visit our October index newsletter. |
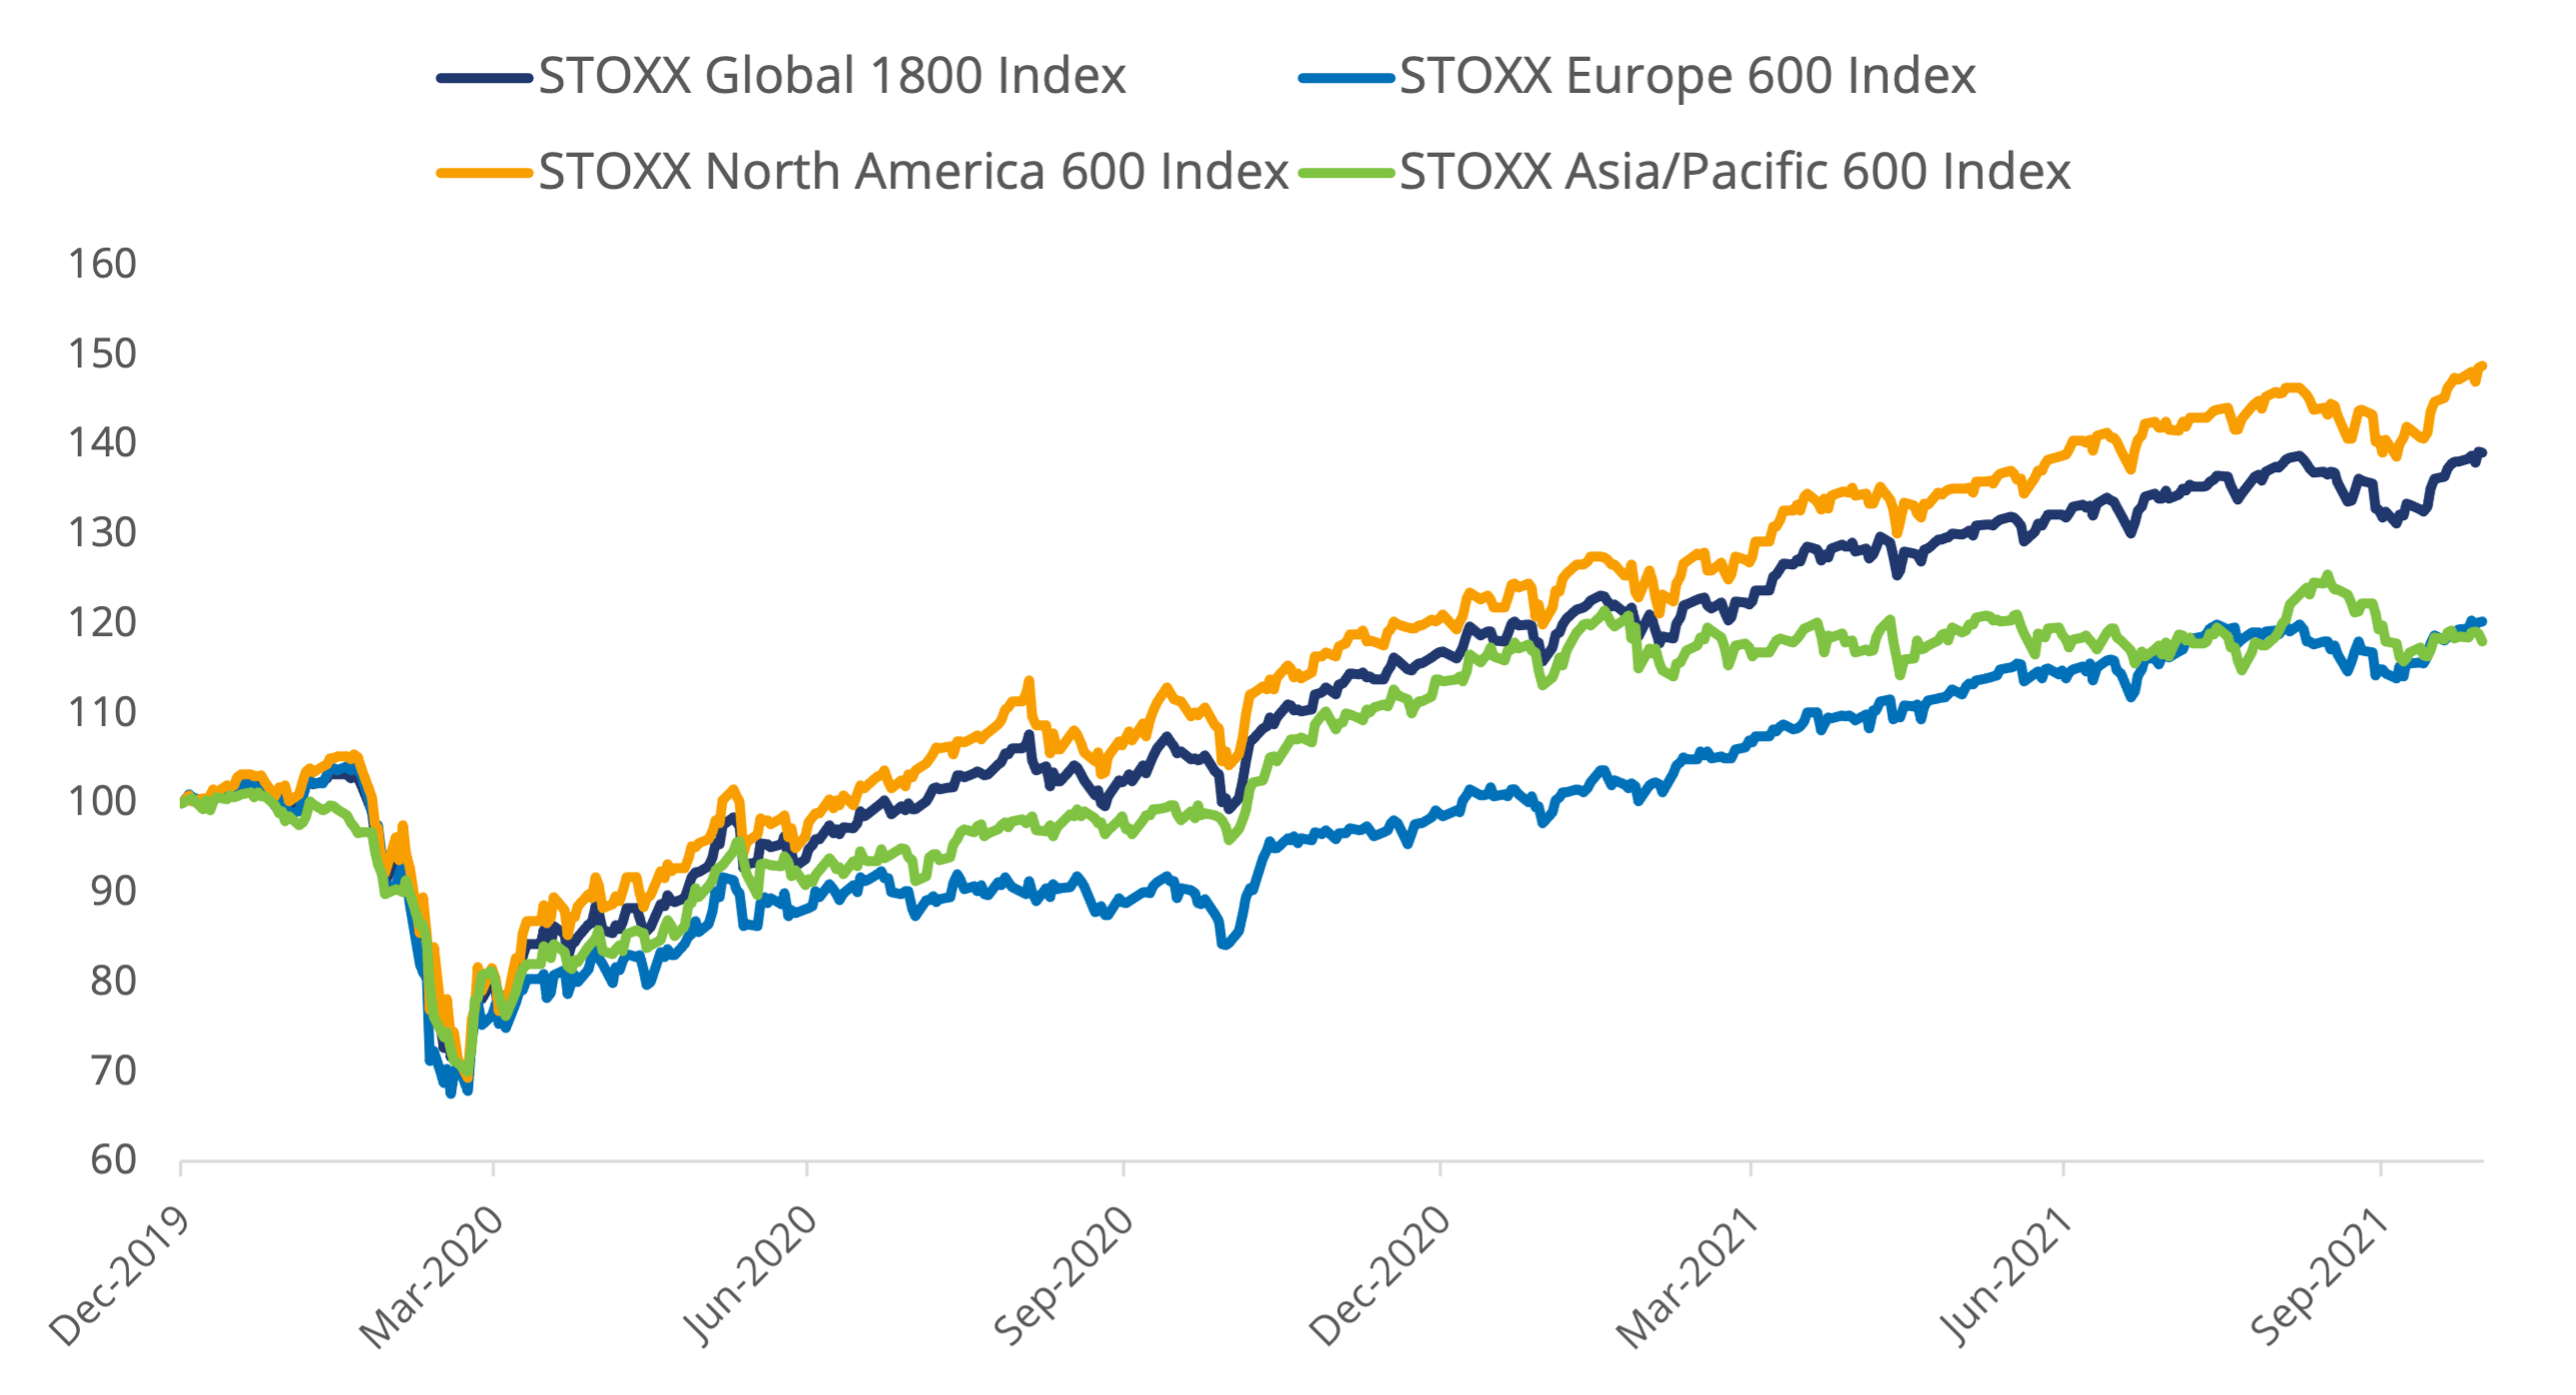
The STOXX Global 1800 is headed for its ninth annual advance in the past ten years. The index has posted a yearly average gain of more than 13% over the period.
Figure 2 – Returns since January 1, 2020
Through October 29, American companies reported third-quarter earnings that were 39% higher than in the same period a year earlier, according to Refinitiv data. More than 82% of those releases beat analysts’ estimates, the research company said.
European Central Bank President Christine Lagarde told a press conference on October 28 that the bank is not planning on raising interest rates next year even as inflation accelerates. Her outlook helped calm some investors’ concerns that policymakers around the world may halt the equities rally by lifting borrowing costs.
Volatility rises
The EURO STOXX 50® Volatility (VSTOXX®) Index, which tracks EURO STOXX 50 options prices, fell to 17.6 at the end of last month from 23.2 in September. A higher VSTOXX reading suggests investors are paying up for puts that offer insurance against stock price drops. The index climbed to 86 in March 2020 as countries restricted work and social activities.
Developed and emerging markets
All but one — Japan — of 25 developed markets tracked by STOXX climbed during October when measured in dollars. The STOXX® Developed Markets 2400 Index advanced 5.5% in dollars and 5.6% in euros.
Fourteen of the 21 national developing markets gained in the month on a dollar basis. The STOXX® Emerging Markets 1500 Index still slid 0.4% in the US currency and 0.2% in euros.
Automobiles on top
All but two of 20 Supersectors in the STOXX Global 1800 rose in the month. The STOXX® Global 1800 Automobiles & Parts Index (+20%)3 yielded the strongest returns. At the other end, the STOXX® Global 1800 Telecommunications Index dropped 2.5%.
Momentum factor regains lead
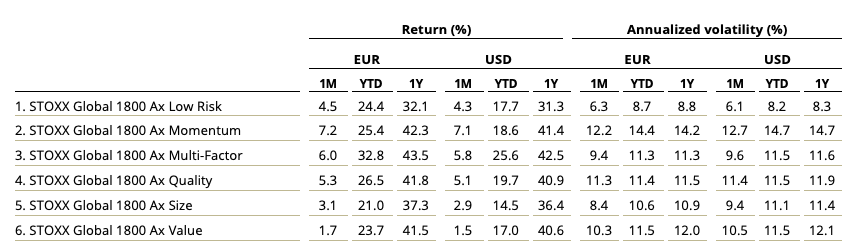
With strong benchmark returns, factor-based investing failed to catch up with the broader market. Most strategies tracked by the STOXX Factor Indices underperformed during October. Momentum was an exception, regaining its leadership within the indices. The STOXX® Global 1800 Ax Momentum Index jumped 7.1%. The STOXX® Global 1800 Ax Value Index rose the least: +1.5%.
Figure 3 – STOXX Factor (Global) indices’ October risk and return characteristics
On a regional basis, the steepest gains within factor indices came from the STOXX® Europe 600 Ax Momentum Index (+6.1%) and STOXX® USA 900 Ax Momentum Index (+8.3%). In Asia/Pacific, all factors logged a negative return, with the STOXX® Asia/Pacific 600 Ax Value Index (-2.6%) faring the poorest.
The STOXX® Global 1800 ESG-X Ax Momentum Index (+7.5%) led gains among the Global ESG-X Factor Indices. These apply the same factor approach as the Global Factor Indices but additionally exclude companies involved in controversial activities from a sustainability point of view.
ESG-X and ESG integration indices
The STOXX® ESG-X indices, which are versions of traditional, market-capitalization-weighted benchmarks that observe standard responsible exclusions of leading asset owners, had similar performances to benchmarks during the month. The STOXX® Global 1800 ESG-X Index advanced 5.6%.
Within indices that combine exclusions and ESG integration, the EURO STOXX 50® ESG Index (+5.1%) had similar returns to its benchmark. Germany’s DAX® 50 ESG Index (+2.9%), which excludes companies involved in controversial activities and integrates ESG scoring into stock selection, outperformed the benchmark DAX® (+2.8%) slightly.
Sustainability indices
Among other families in the STOXX sustainability index framework, the STOXX® Global 1800 ESG Broad Market Index added 5.7%. The STOXX ESG Broad Market Indices apply a set of compliance, product involvement and ESG performance exclusionary screens on a starting benchmark universe until only the 80% top ESG-rated constituents remain. Companies that are non-compliant based on Sustainalytics’ Global Standards Screening assessment, or are involved in controversial weapons, are not eligible for selection. Additional filters exclude companies involved in tobacco production, thermal coal and military contracting.
Next, the STOXX® Global 1800 ESG Target Index gained 5.6% in October, the EURO STOXX® ESG Target Index rose 4.2% and the DAX® ESG Target Index climbed 3.3%. The STOXX and DAX ESG Target Indices seek to significantly improve the benchmark portfolio’s ESG profile while mirroring its returns as closely as possible. The indices follow a similar initial selection methodology as the STOXX ESG Broad Market Indices. From that selection pool they implement, through a series of constraints, an optimization process to maximize the overall ESG score of the portfolio while constraining the tracking error to the benchmark.
The STOXX® Global 1800 ESG Target TE Index, meanwhile, also gained 5.6% last month and the EURO STOXX® ESG Target TE Index rose 4.3%. The STOXX ESG TE Indices follow a similar methodology to the ESG Target Indices, but the optimization imposes a tracking error minimization, subject to a constraint of improving the ESG score of the resulting portfolio.
Finally, the STOXX® Global 1800 SRI Index gained 4.7%. The STOXX SRI indices apply a rigorous set of carbon emission intensity, compliance and involvement screens, and track the best ESG performers in each industry group within a selection of STOXX benchmarks. In the month that ended, the SRI indices produced returns that topped those of benchmarks.
Climate benchmarks
There were strong relative performances from the STOXX Paris-Aligned Benchmark Indices (PABs) and the STOXX Climate Transition Benchmark Indices (CTBs). The STOXX® Global 1800 PAB Index and the STOXX® Global 1800 CTB Index gained 6.6% and 6.8%, respectively. The indices were introduced last year and follow the requirements outlined by the European Commission’s Technical Expert Group (TEG) on climate benchmarks.
Among the STOXX Low Carbon Indices, the EURO STOXX 50® Low Carbon Index (+4.5%) lagged the EURO STOXX 50 by 72 basis points in the month. Elsewhere, the STOXX® Global Climate Change Leaders Index (+5.9%), which selects corporate leaders that are publicly committed to reducing their carbon footprint, returned 40 basis points more than the STOXX Global 1800 benchmark.
Thematic indices
The STOXX® Thematic Indices had relatively poor performances last month. The indices seek exposure to the economic upside of disruptive global megatrends and follow two approaches: revenue-based and artificial-intelligence-driven.
Only six of 22 revenue-based thematic indices beat the STOXX Global 1800 Index during October. The STOXX® Global Smart Cities Index was the month’s best performer after jumping 12%.
Among the STOXX artificial-intelligence-driven thematic indices, the STOXX® AI Global Artificial Intelligence Index (+4.3%) and its ADTV5 version (+4.4%) underperformed the benchmark. The iSTOXX® Yewno Developed Markets Blockchain Index (+6.7%), on the other hand, outperformed.
Dividend strategies
Dividend strategies also underperformed in the month that ended.
The STOXX® Global Maximum Dividend 40 Index (-0.7%) selects only the highest-dividend-yielding stocks. The STOXX® Global Select Dividend 100 Index (+1.9%), meanwhile, tracks companies with sizeable dividends but also applies a quality filter such as a history of stable payments. The STOXX® Global ESG-X Select Dividend 100 Index (+2%) was introduced last February and targets the highest-yielding stocks within universes screened for responsible investment criteria.
The STOXX® Global Select 100 EUR Index, which blends increasing dividend yields with low volatility and is calculated in euros, advanced 2%.
Minimum variance
Minimum variance strategies had weak returns in European markets for a third consecutive month, relative to benchmarks. The STOXX® Europe 600 Minimum Variance Index rose 2.2%, while its unconstrained version gained only 1%. The STOXX® Global 1800 Minimum Variance Index added 3.6% and the STOXX® Global 1800 Minimum Variance Unconstrained Index rose 2.2%.
The STOXX Minimum Variance Indices come in two versions. A constrained version has similar exposure to its market-capitalization-weighted benchmark but with lower risk. The unconstrained version, on the other hand, has more freedom to fulfill its minimum variance mandate within the same universe of stocks.
1 All results are total returns before taxes unless specified.
2 Throughout the article, all European indices are quoted in euros, while global, North America, US, Japan and Asia/Pacific indices are in dollars.
3 Figures in parentheses show last month’s gross returns.


