

Stocks jumped by the most in 20 months in July as investors focused on better-than-forecast earnings reports and on expectations that the Federal Reserve may slow down the pace of interest-rate increases.
The STOXX® Global 1800 index rose 7.9% in the month when measured in dollars and including dividends,1 its best showing since November 2020. The index gained 10.6% in euros after the common currency dropped 3.1% against the greenback. The benchmark is still down 14.4% in 2022, poised for its worst year since the Global Financial Crisis in 2008.
The STOXX® North America 600 jumped 9.2% in dollars in July, while the STOXX® USA 500 added 9.4%.2 The pan-European STOXX® Europe 600 climbed 7.8% in euros and the Eurozone’s EURO STOXX 50® added 7.5%. The STOXX® Asia/Pacific 600 increased 4.7% in dollars.
Figure 1: Benchmark indices’ July risk and return characteristics
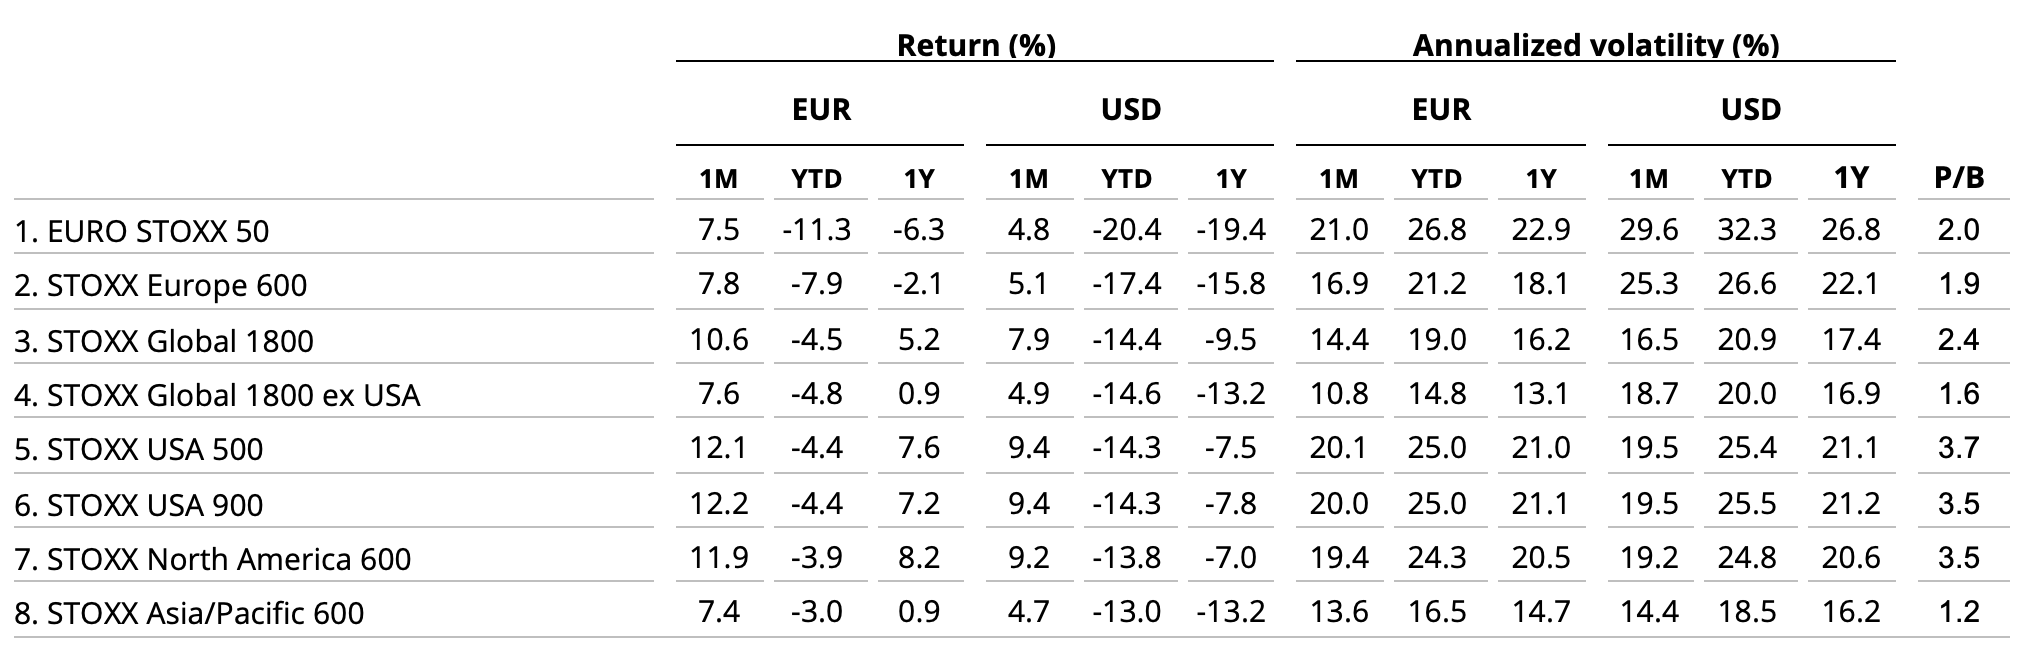
Germany’s DAX® rose 5.5% in the month. MDAX®, which gauges the performance of German mid-caps, gained 6%.
US recession
The US reported on July 28 that its economy shrunk by an annual 0.9% in the second quarter. That was the second consecutive quarterly contraction, an event that generally defines a recession. The release came a day after the Federal Reserve raised the key interest rate by 0.75 percentage points for a second consecutive month. Speaking after the policy announcement, Fed chair Jay Powell said it could be ‘appropriate to slow’ the pace of monetary tightening.
Earnings reports during the month suggested some companies are weathering the impact of high inflation and slowing growth better than others. While Walmart Inc. reduced its full-year profit guidance, companies including Amazon.com Inc. and Apple Inc. reported better-than-expected revenue for the second quarter. More than two thirds of US companies that reported second-quarter earnings by Aug. 1 beat estimates.3
July’s rebound comes as a respite to investors battered this year by market losses as the Fed and other central banks fight multi-decade high inflation by rising interest rates. The STOXX Global 1800 index in June slid into a bear market, commonly defined as a retreat of 20% or more.
| For a complete review of all indices’ performance last month, visit our July index newsletter. |
Figure 2: Annual % returns for STOXX Global 1800 index
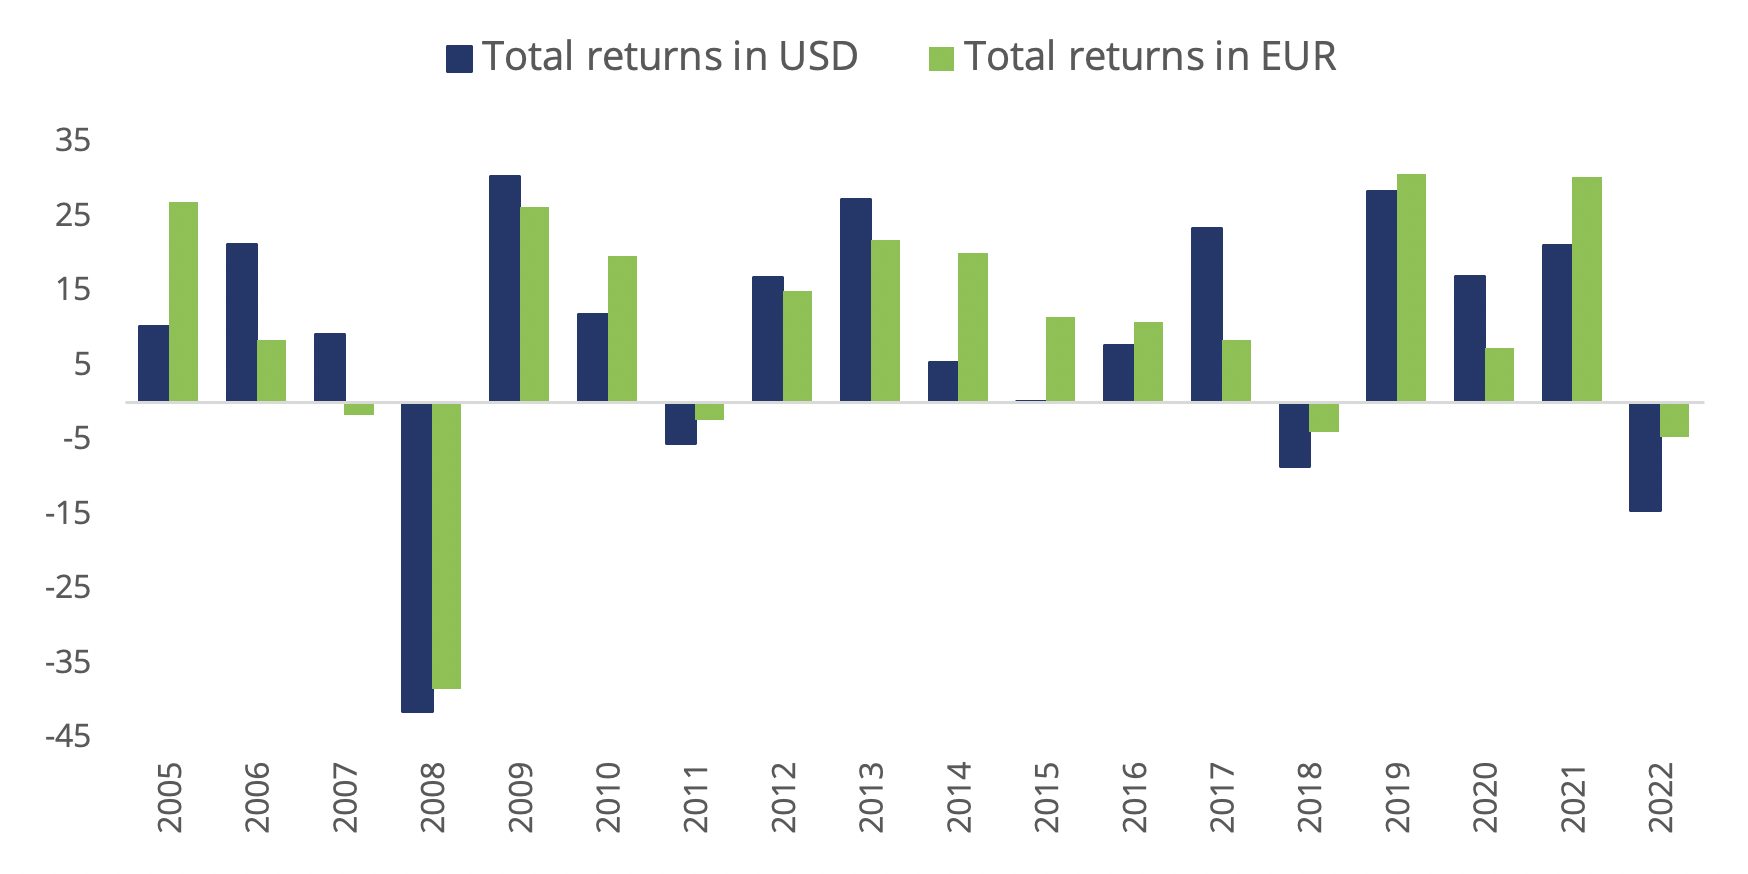
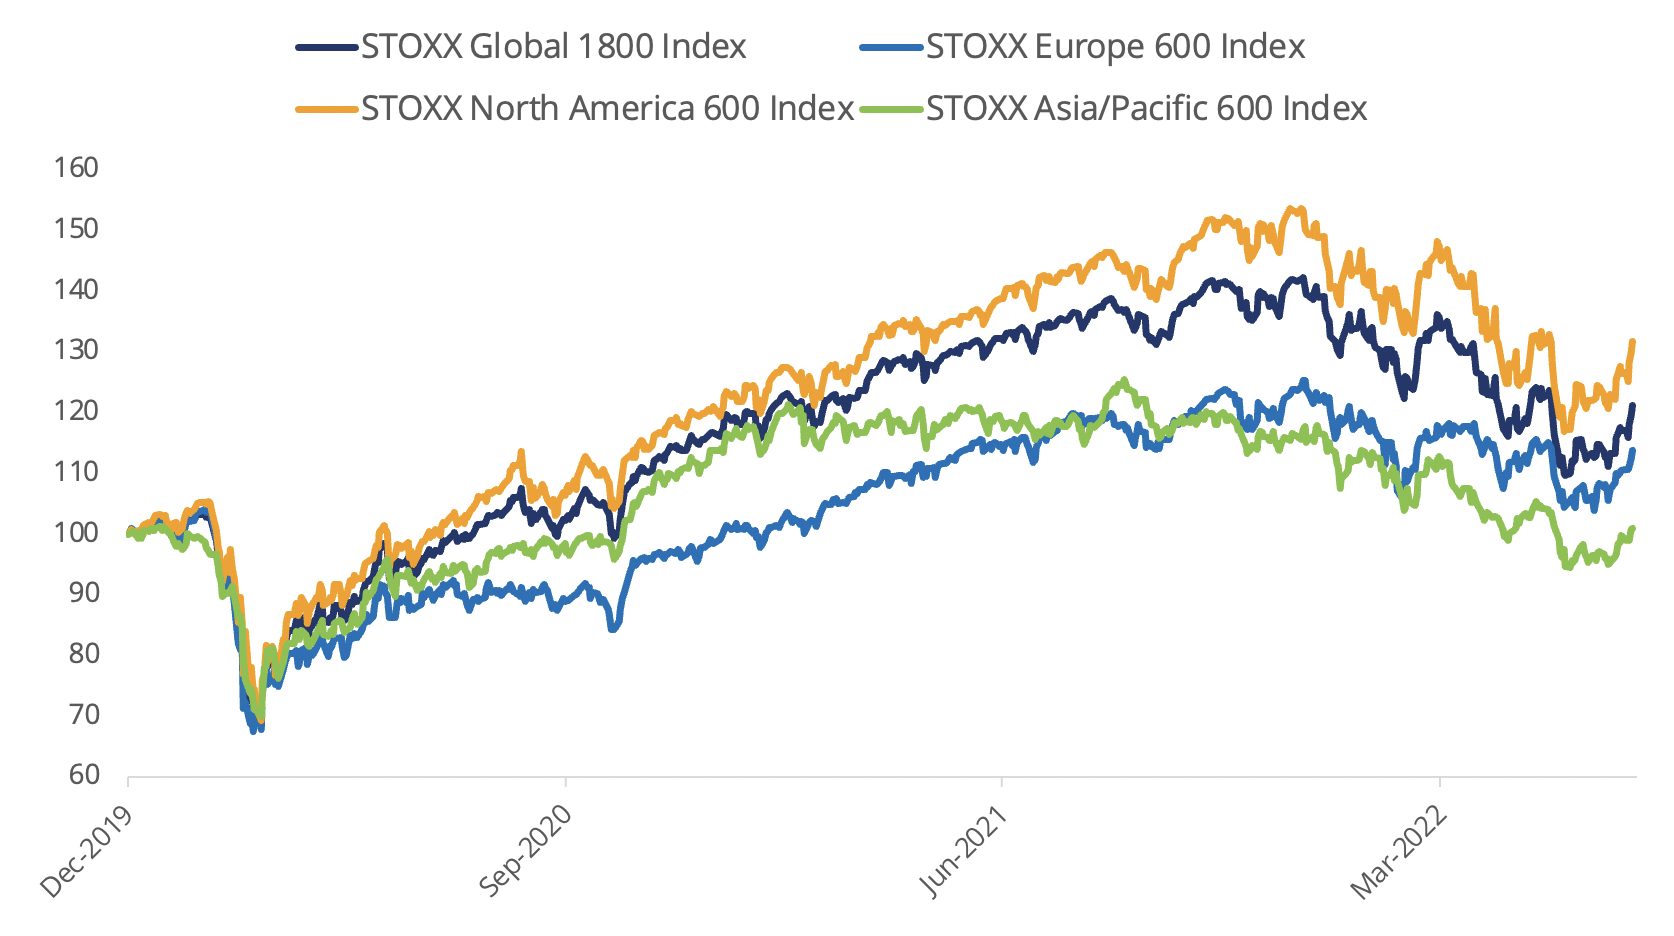
Figure 3: Returns since January 1, 2020
Volatility drops
The EURO STOXX 50® Volatility (VSTOXX®), which tracks EURO STOXX 50 options prices, slipped to 22.3 at the end of last month from 29.8 in June. A higher VSTOXX reading suggests investors are paying up for puts that offer insurance against stock price drops. The VDAX-New®, which tracks volatility in German equities, dropped to 23.8 from 29.8 in June.
Developed and emerging markets
All but three of 25 developed markets tracked by STOXX advanced during July when measured in dollars. The STOXX® Developed Markets 2400 index gained 8% in dollars and 10.8% in euros.
Sixteen of 20 national developing markets rose in the month on a dollar basis. The STOXX® Emerging Markets 1500 index added 3.5% in the US currency and 6.1% in euros.
Automakers lead gains in month
All but two of the 20 Supersectors in the STOXX Global 1800 had positive returns. The STOXX® Global 1800 Automobiles & Parts (18%)4 led gains.
Factor strategis
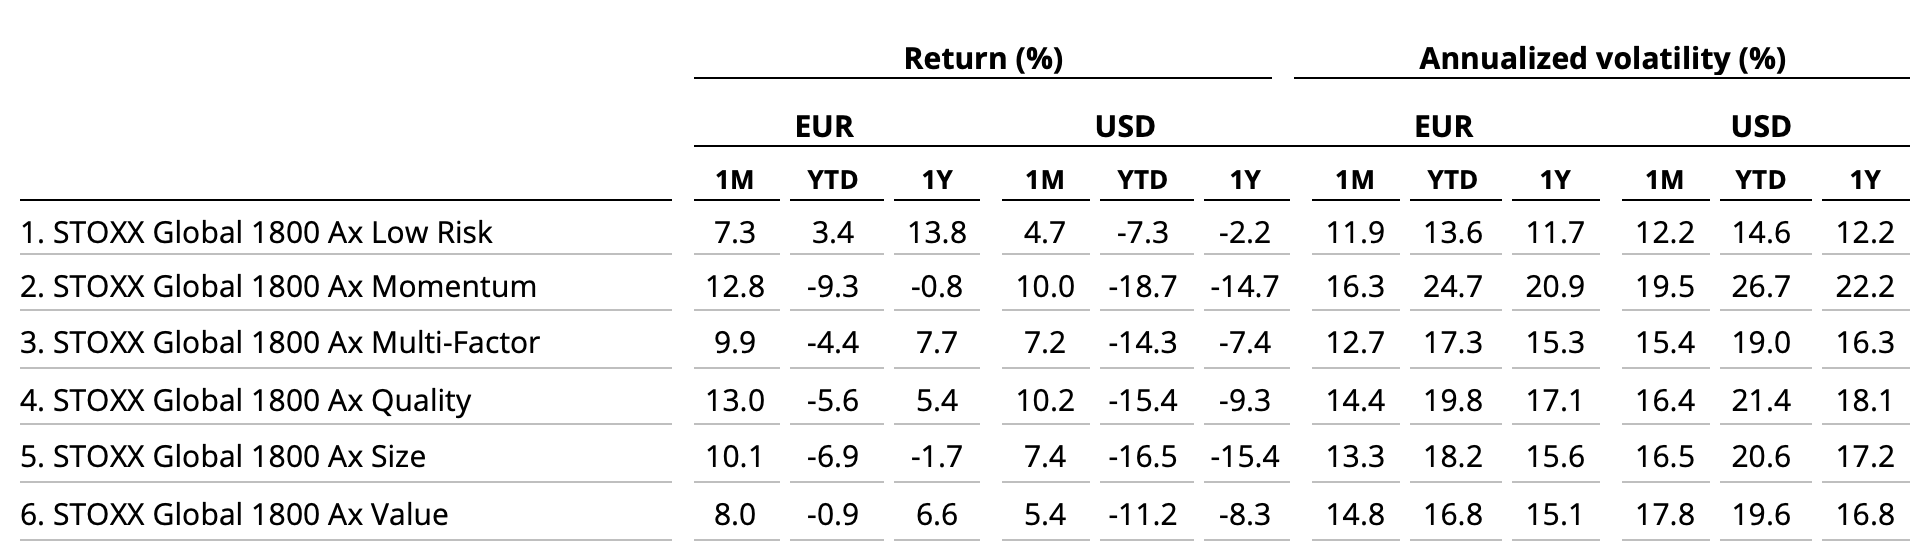
Quality and Momentum were the best-performing styles in the month that ended, while Low Risk fared the worst, according to the STOXX Factor indices. The STOXX® Global 1800 Ax Quality gained 10.2% and the STOXX® Global 1800 Ax Momentum rose 10%.
Figure 4: STOXX Factor (Global) indices’ July risk and return characteristics
Climate benchmarks
Among climate benchmarks, the STOXX® Global 1800 Paris-Aligned Benchmark (PAB) and the STOXX® Global 1800 Climate Transition Benchmark (CTB) rose 7.9% and 7.8%, respectively. The PAB and CTB indices follow the requirements outlined by the European Commission’s climate benchmarks regulation.
The STOXX® Willis Towers Watson World Climate Transition Index climbed 8.1%. The STOXX Willis Towers Watson Climate Transition Indices (CTIs) employ a unique Climate Transition Value at Risk (CTVaR) methodology that quantifies the anticipated impact of an economic transition on equity valuations. The CTIs look beyond carbon emissions and make a forward-looking, bottom-up evaluation of asset repricing risks in a decarbonization pathway.
Among the STOXX Low Carbon indices, the EURO STOXX 50® Low Carbon (7.1%) trailed the EURO STOXX 50 by 34 basis points in July. Elsewhere, the STOXX® Global Climate Change Leaders (5.4%), which selects corporate leaders that are publicly committed to reducing their carbon footprint, underperformed the STOXX Global 1800 index by 2.5 percentage points.
ESG-X and ESG indices
The STOXX® Global 1800 ESG-X index rose 8.1% in the month. The STOXX® ESG-X indices are versions of traditional, market-capitalization-weighted benchmarks that observe standard responsible exclusions of leading asset owners.
Within indices that combine exclusions and ESG best-in-class integration, the EURO STOXX 50® ESG index gained 7.3%. Germany’s DAX® 50 ESG index (4.7%), which excludes companies involved in controversial activities and integrates ESG scoring into stock selection, underperformed the benchmark DAX.
Sustainability indices
Among other STOXX sustainability families, the STOXX® Global 1800 ESG Broad Market index rose 7.9% in the month. The STOXX ESG Broad Market indices apply a set of compliance, product involvement and ESG performance exclusionary screens on a starting benchmark universe until only the 80% top ESG-rated constituents remain.
The STOXX® Global 1800 ESG Target rose 7.5%, the EURO STOXX® ESG Target gained 7.2% and the DAX® ESG Target climbed 4.9%. The STOXX and DAX ESG Target indices seek to significantly improve the benchmark portfolio’s ESG profile while mirroring its returns as closely as possible. Through a series of constraints, the indices implement an optimization process to maximize the overall ESG score of the portfolio while limiting the tracking error to the benchmark.
The STOXX® Global 1800 SRI advanced 7.8%. The STOXX SRI indices apply a rigorous set of carbon emission intensity, compliance and involvement screens, and track the best ESG performers in each industry group within a selection of STOXX benchmarks.
Finally, the DAX® ESG Screened climbed 4.6%. The index reflects the composition of the DAX benchmark minus companies that fail to pass norms-based and controversial weapons screenings, meet minimum ESG ratings or are involved in certain business activities considered undesirable from a responsible investing perspective.
Thematic indices
There were mixed performances relative to the benchmark from the STOXX® Thematic indices in the month that ended. The indices seek exposure to the economic upside of disruptive global megatrends and follow two approaches: revenue-based and artificial-intelligence-driven.
Sixteen of 24 revenue-based thematic indices outperformed the STOXX Global 1800. The STOXX® Global Sharing Economy (14.6%) was the group’s best performer.
Among the STOXX artificial-intelligence-driven thematic indices, the STOXX® AI Global Artificial Intelligence index (8.7%) and its ADTV5 version (8.9%) outperformed the STOXX Global 1800 index during July. The iSTOXX® Yewno Developed Markets Blockchain index rose 6.8%.
Dividend strategies
Dividend strategies also struggled relative to benchmarks. The STOXX® Global Maximum Dividend 40 (3.1%) selects only the highest-dividend-yielding stocks. The STOXX® Global Select Dividend 100 (3.3%), meanwhile, tracks companies with sizeable dividends but also applies a quality filter such as a history of stable payments.
Minimum variance
There were also weak relative performances from Minimum variance strategies. The STOXX® Global 1800 Minimum Variance gained 5.8%, while the STOXX® Global 1800 Minimum Variance Unconstrained rose only 1.7%. The STOXX® Europe 600 Minimum Variance index gained 5.5%, while its unconstrained version climbed 3.3%.
The STOXX Minimum Variance Indices come in two versions. A constrained version has similar exposure to its market-capitalization-weighted benchmark but with lower risk. The unconstrained version, on the other hand, has more freedom to fulfill its minimum variance mandate within the same universe of stocks.
1 All results are total returns before taxes unless specified.
2 Throughout the article, all European indices are quoted in euros, while global, North America, US, Japan and Asia/Pacific indices are in dollars.
3 Forbes, ‘Positive Second-Quarter Earnings Surprises Continue To Support Stocks,’ Aug. 1, 2022.
4 Figures in parentheses show last month’s gross returns.


