

In September, stocks suffered the worst monthly selloff since March 2020, with the STOXX® Global 1800 index erasing all of its gains from the northern hemisphere’s summer, as central banks around the world pushed ahead with more interest-rate hikes.
The global benchmark lost 9.3% last month when measured in dollars and including dividends1, ending at its lowest level since November 2020. The benchmark fell 6.9% in euros after the greenback rose 2.6% against the common currency. The STOXX Global 1800 posted a loss of 6.1% in dollars in the third quarter, its third consecutive quarterly loss, and is poised for its worst year since the Global Financial Crisis in 2008.
The STOXX® North America 600 fell 9.2% in dollars in September, as did the STOXX® USA 5002. The pan-European STOXX® Europe 600 dropped 6.5% in euros and the Eurozone’s EURO STOXX 50® decreased 5.5%. The STOXX® Asia/Pacific 600 declined 10.5% in dollars.
Figure 1: Benchmark indices’ September risk and return characteristics
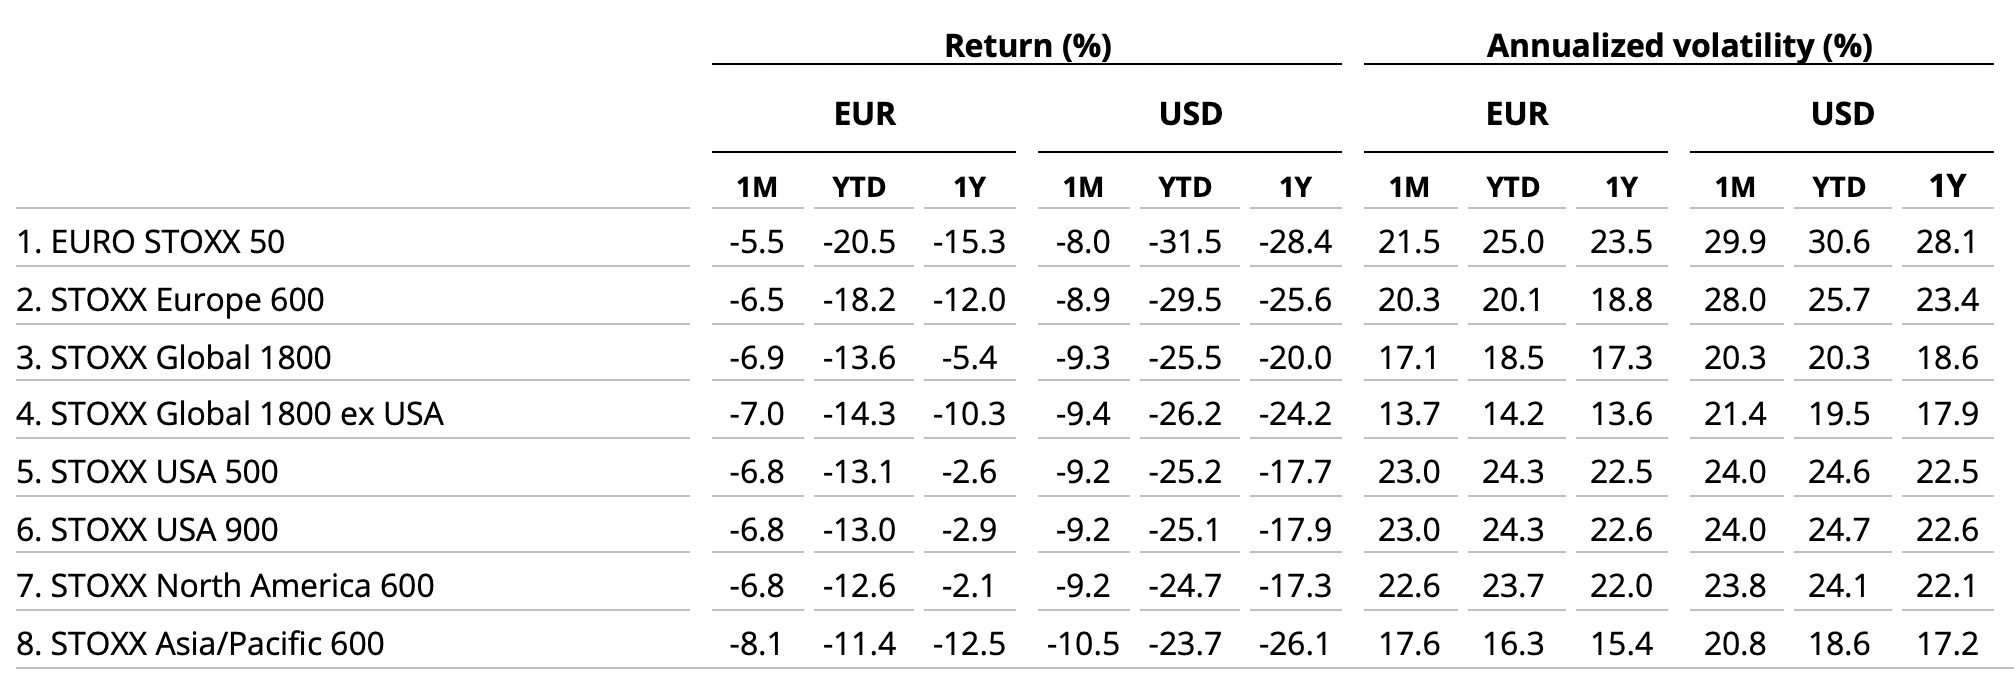
Germany’s DAX® lost 5.6% in the month. MDAX®, which gauges the performance of German mid-caps, dropped 11.3%.
Putting the brakes on growth
The Federal Reserve, European Central Bank and Bank of England were among central banks that raised their key interest rates during September as they fight runaway inflation, putting the brakes on economic growth. The Fed, ECB and Bank of Canada increased the cost of borrowing by a larger-than-average 75 basis points in the month.
| For a complete review of all indices’ performance last month, visit our September index newsletter. |
Figure 2: Annual % returns for STOXX Global 1800 index
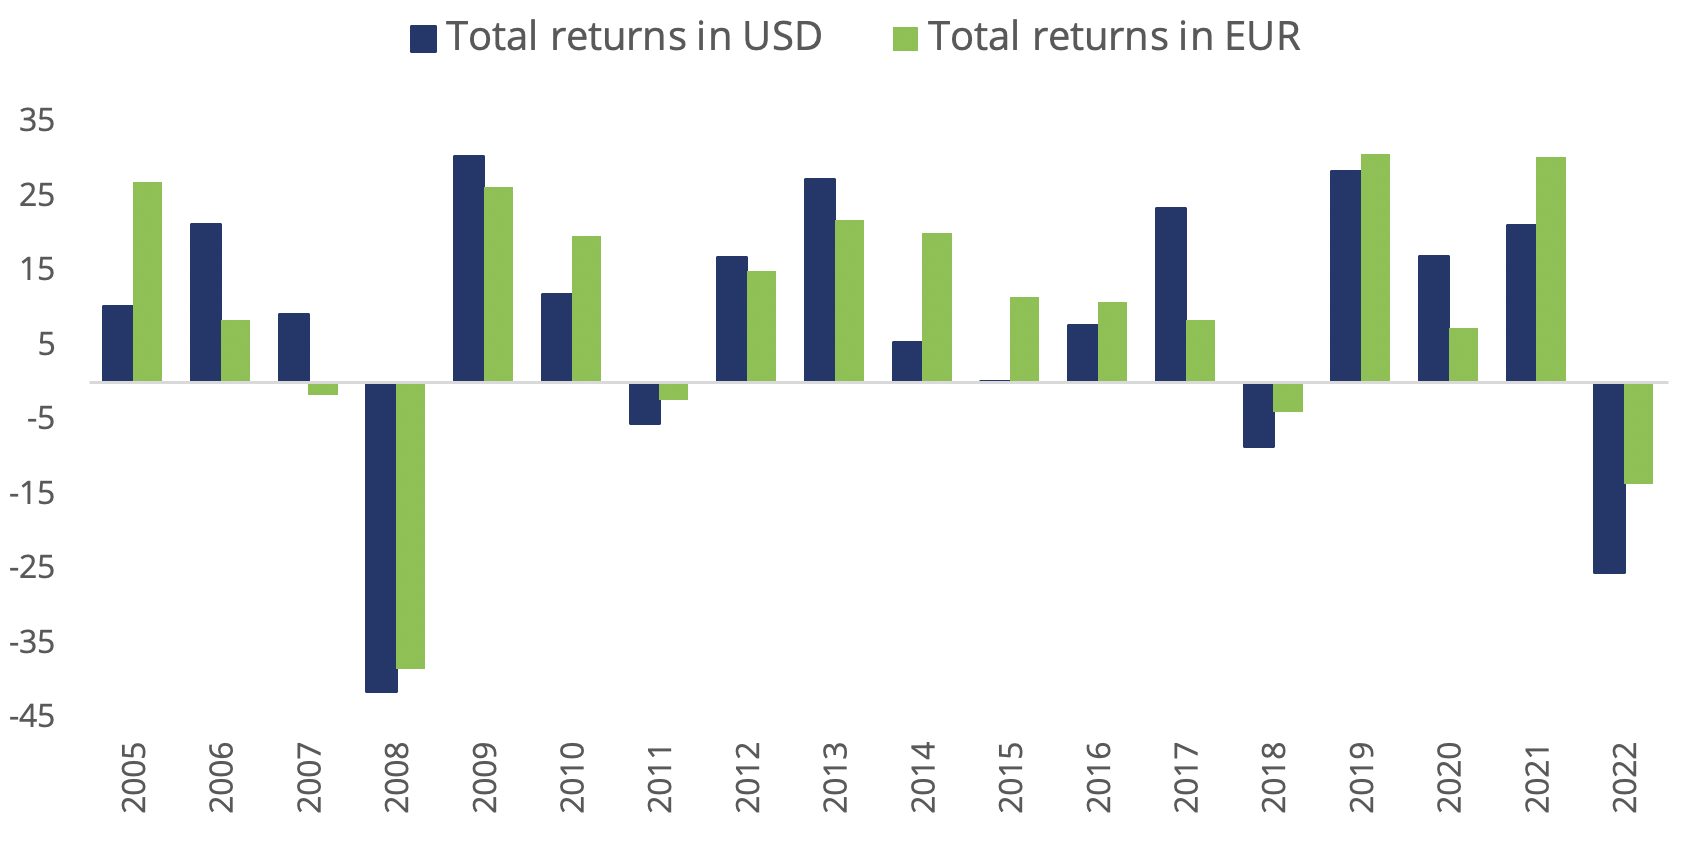
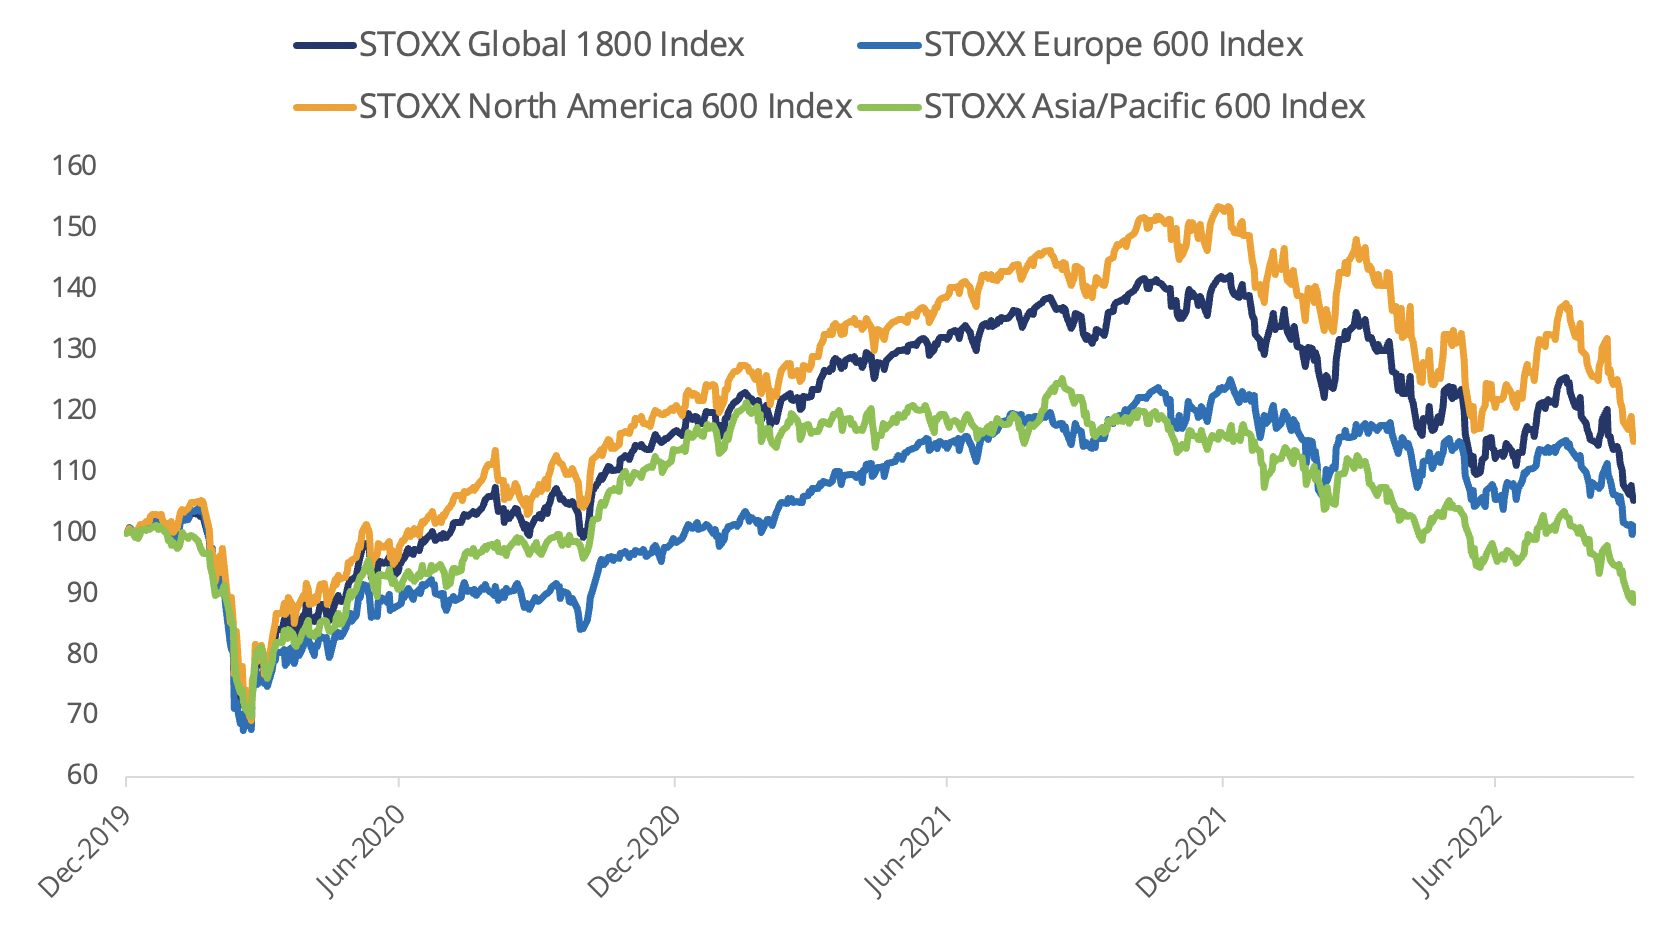
Figure 3: Returns since January 1, 2020
Volatility rises
The EURO STOXX 50® Volatility (VSTOXX®), which tracks EURO STOXX 50 options prices, rose to 30.7 at the end of last month from 27.9 in August. A higher VSTOXX reading suggests investors are paying up for puts that offer insurance against stock price drops. The VDAX-New®, which measures volatility in German equities, also climbed to 30.7, from 28.7 in August.
Most national markets retreat
All 25 developed markets tracked by STOXX declined in September when measured in dollars. The STOXX® Developed Markets 2400 index slid 9.3% in dollars and 6.9% in euros.
Nineteen of 20 national developing markets fell in the month on a dollar basis, with Mexico the sole exception. The STOXX® Emerging Markets 1500 index lost 10.4% in the US currency and 8% in euros.
Real estate at bottom
All 20 Supersectors in the STOXX Global 1800 had a negative return in the month. The STOXX® Global 1800 Real Estate led losses with a 12.8% drop.
Factor investing
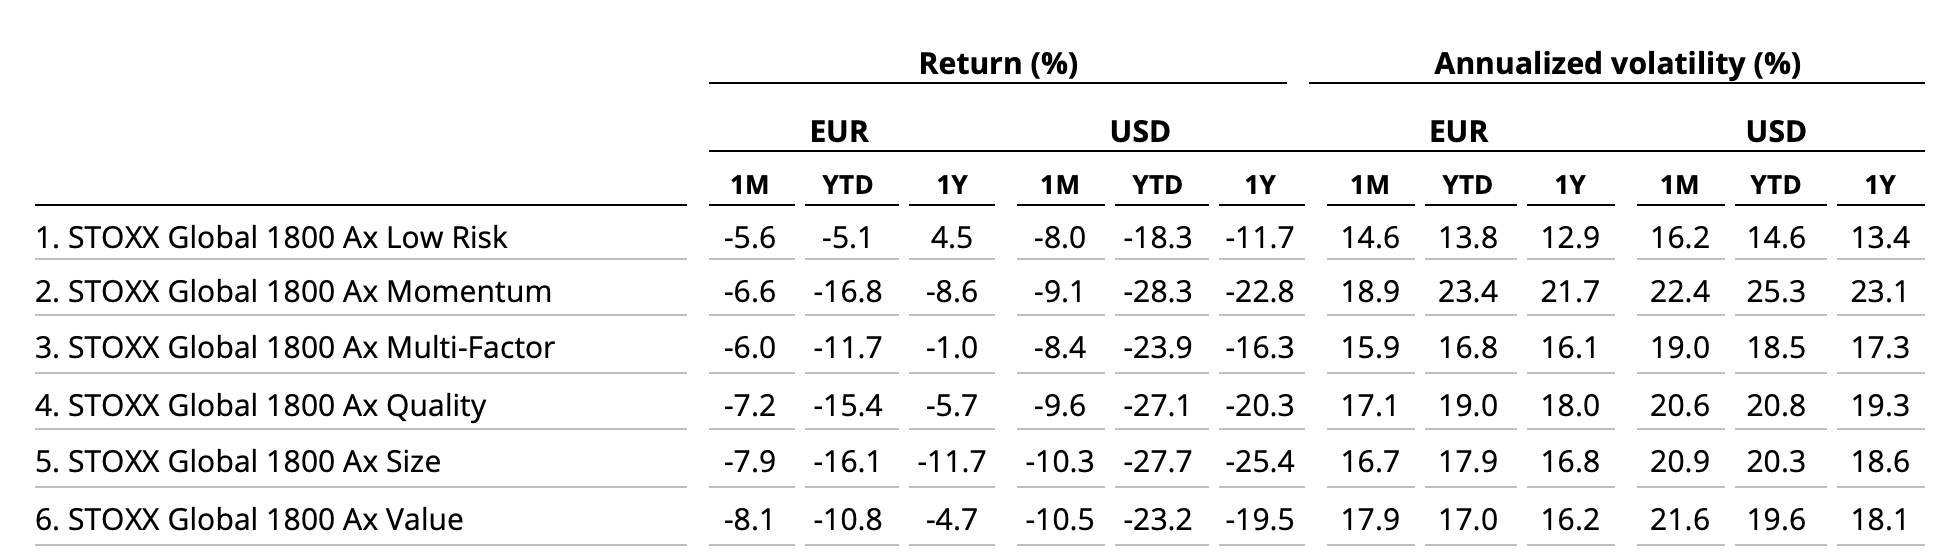
Value was the worst-performing style in the month, while Low Risk fared the best, according to the STOXX Factor indices. The STOXX® Global 1800 Ax Value tumbled 10.5%.
Figure 4: STOXX Factor (Global) indices’ September risk and return characteristics
Climate benchmarks
Among climate benchmarks, the STOXX® Global 1800 Paris-Aligned Benchmark (PAB) and the STOXX® Global 1800 Climate Transition Benchmark (CTB) fell 9.1% and 9.3%, respectively. The PAB and CTB indices follow the requirements outlined by the European Commission’s climate benchmarks regulation.
The STOXX® Willis Towers Watson World Climate Transition Index retreated 9.2%. The STOXX Willis Towers Watson Climate Transition Indices (CTIs) employ a unique Climate Transition Value at Risk (CTVaR) methodology that quantifies the anticipated impact of an economic transition on equity valuations. The CTIs look beyond carbon emissions and make a forward-looking, bottom-up evaluation of asset repricing risks in a decarbonization pathway.
Among the STOXX Low Carbon indices, the EURO STOXX 50® Low Carbon (-5.5%)3 performed in line with the EURO STOXX 50. Elsewhere, the STOXX® Global Climate Change Leaders (-10.1%), which selects corporate leaders that are publicly committed to reducing their carbon footprint, underperformed the STOXX Global 1800 index by 84 basis points.
ESG-X and ESG indices
The STOXX® Global 1800 ESG-X index fell 9.2% in the month. The STOXX® ESG-X indices are versions of traditional, market-capitalization-weighted benchmarks that observe standard responsible exclusions of leading asset owners.
Within indices that combine exclusions and ESG best-in-class integration, the EURO STOXX 50® ESG index dropped 5.1%. Germany’s DAX® 50 ESG index (-6.2%), which excludes companies involved in controversial activities and integrates ESG scoring into stock selection, underperformed the benchmark DAX.
Sustainability indices
Among other STOXX sustainability families, the STOXX® Global 1800 ESG Broad Market index lost 9.3% in the month. The STOXX ESG Broad Market indices apply a set of compliance, product involvement and ESG performance exclusionary screens on a starting benchmark universe until only the 80% top ESG-rated constituents remain.
The STOXX® Global 1800 ESG Target slid 9.5%, the EURO STOXX® ESG Target fell 6.4% and the DAX® ESG Target dropped 5.5%. The STOXX and DAX ESG Target indices seek to significantly improve the benchmark portfolio’s ESG profile while mirroring its returns as closely as possible. Through a series of constraints, the indices implement an optimization process to maximize the overall ESG score of the portfolio while limiting the tracking error to the benchmark.
The STOXX® Global 1800 SRI dropped 9.6%. The STOXX SRI indices apply a rigorous set of carbon emission intensity, compliance and involvement screens, and track the best ESG performers in each industry group within a selection of STOXX benchmarks.
Finally, the DAX® ESG Screened fell 5.5%. The index reflects the composition of the DAX benchmark minus companies that fail to pass norms-based and controversial weapons screenings, meet minimum ESG ratings or are involved in certain business activities considered undesirable from a responsible investing perspective.
Thematic indices
There were weak performances relative to the benchmark from the STOXX® Thematic indices in the month that ended. The indices seek exposure to the economic upside of disruptive global megatrends and follow two approaches: revenue-based and artificial-intelligence-driven.
Eighteen of 24 revenue-based thematic indices underperformed the STOXX Global 1800. The STOXX® Global Video Gaming & eSports (-13.9%) was the group’s worst performer.
Among the STOXX artificial-intelligence-driven thematic indices, the STOXX® AI Global Artificial Intelligence index (-10.8%) and its ADTV5 version (-10.8%) underperformed the STOXX Global 1800 index during September. The iSTOXX® Yewno Developed Markets Blockchain index fell 9%.
Dividend strategies
Most dividend strategies also struggled last month. The STOXX® Global Maximum Dividend 40 (-11.2%) selects only the highest-dividend-yielding stocks. The STOXX® Global Select Dividend 100 (-9.2%), meanwhile, tracks companies with sizeable dividends but also applies a quality filter such as a history of stable payments.
Minimum variance
There were strong relative performances from Minimum variance strategies covering the US last month. The STOXX® Global 1800 Minimum Variance lost 7.8%, while the STOXX® Global 1800 Minimum Variance Unconstrained dropped 8.2%. The STOXX® Europe 600 Minimum Variance index lost 6.7%, while its unconstrained version shed 6.8%. The STOXX® USA 900 Minimum Variance index retreated 6.3% and its unconstrained version lost 6.5%.
The STOXX Minimum Variance Indices come in two versions. A constrained version has similar exposure to its market-capitalization-weighted benchmark but with lower risk. The unconstrained version, on the other hand, has more freedom to fulfill its minimum variance mandate within the same universe of stocks.
1 All results are total returns before taxes unless specified.
2 Throughout the article, all European indices are quoted in euros, while global, North America, US, Japan and Asia/Pacific indices are in dollars.
3 Figures in parentheses show last month’s gross returns.


