

The following article was published on Risk.net.
The benefits of a strict rules-based approach to the construction of style-based portfolios are well known. Portfolios are constructed to tilt on factors with proven track records of driving outperformance, and often-wrong emotions that can drive stock selection decisions are absent. The approach remains the same throughout market and economic cycles, and this consistency is an advantage in producing strong risk-adjusted returns.
While style-based managers may not incorporate a top-down economic outlook into the portfolio construction, the macro environment will drive portfolio risk and therefore impact returns. The degree of economic risk seen varies widely per chosen style and may also be mitigated to a small or large extent, depending on the factor, by restricting industry exposures.
A multi-factor approach is a time-honored method of diversifying across compensated factors, improving a portfolio’s risk-return trade-off. It has less macro risk than some single-factor styles, but more macro risk than others and, on its own, is not a reliable way to reduce macroeconomic exposure. However, a side benefit of a multi-factor approach that also restricts industry exposures is that the resulting portfolio tends to have little exposure to economic forces.
Even if a manager does not consider the economic environment when constructing a portfolio or index from the bottom up, it can be helpful to know about the inherent risks – especially in times of economic upheaval.
With this in mind, we used Axioma’s Macroeconomic Projection model to evaluate several STOXX single- and multi-factor style indices[1] to illustrate the degree of economic exposure a manager might experience. This model projects 14 daily-traded economic factors such as term spreads, credit spreads and break-even inflation in several major economies (the US, Europe, the UK and Japan), along with oil, non-oil commodities, gold and carbon emissions futures onto a standard fundamental factor risk model, separating return into that from the economic factors and the residual of the standard style, industry, country and market factors. The total and active risk expectations produced by this model are the same as those from the fundamental model, only the distribution of that risk varies.
Qontigo’s STOXX® Industry Neutral Ax Factor Indices underlie futures listed on Eurex. The suite tracks five popular and well-researched style factors: Value, Momentum, Low Risk, Quality and Size. An additional Multi-Factor strategy combines the five exposures in one index and its respective futures.
Macro variables can be correlated with industry, country and style factors — some more significantly than others
Some of the relationships between economic variables and model factors are to be expected: energy stocks and some country returns (such as Norway) are highly related to oil prices; financial stocks are related to changes in term spreads; and so on. Some style factors are closely tied to economic factors as well. For example, Axioma’s Market Sensitivity factor is highly correlated with term spreads.
What this means is that what a manager may view as risk and return coming from Market Sensitivity is actually a result of portfolio exposures to interest rate variables, with some leftover (or residual) coming from the style factor.
Some style indices have more economic exposure than others
There are two versions of STOXX style indices: one that tightly constrains exposures to ICB industry designations, and one that has less strict industry controls. Exhibit 1 shows the breakdown of risk over the past ten years for selected style indices built from the STOXX® USA 500 parent index according to the Macroeconomic model, and compares the ‘standard’ version with one that has stricter industry-neutrality rules[2]. Risk is calculated at each quarterly rebalance over the past ten years. Exhibit 2 details some summary statistics.
Both versions of the Low Risk Index, which tilts on lower beta and lower volatility stocks, clearly have the most macroeconomic exposure among this set of indices, with an average of more than 30% of the risk coming from these exposures for both standard and industry-neutral portfolios and a maximum of about 56% (see the red shaded portion of Exhibit 1).
Exhibit 1 – Percentage contribution to active risk, STOXX USA 500 style indices
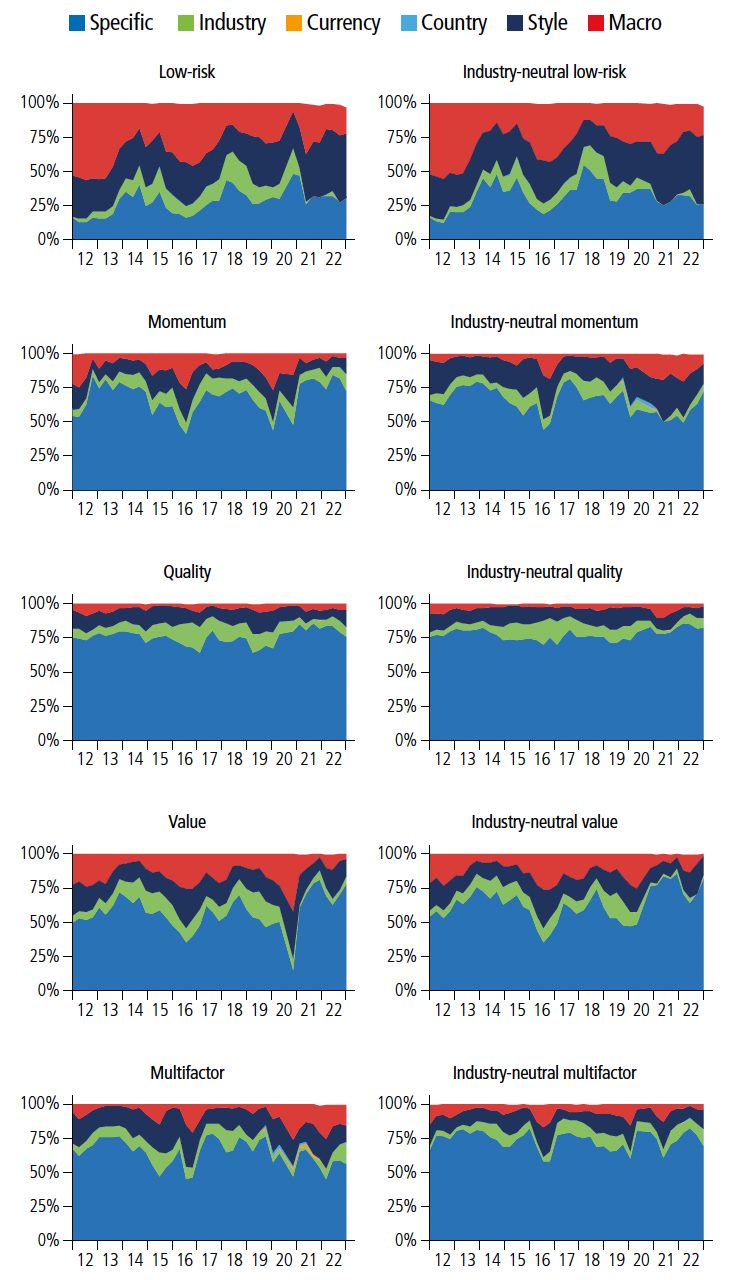
Exhibit 2 – Summary statistics, STOXX USA 500 style indices
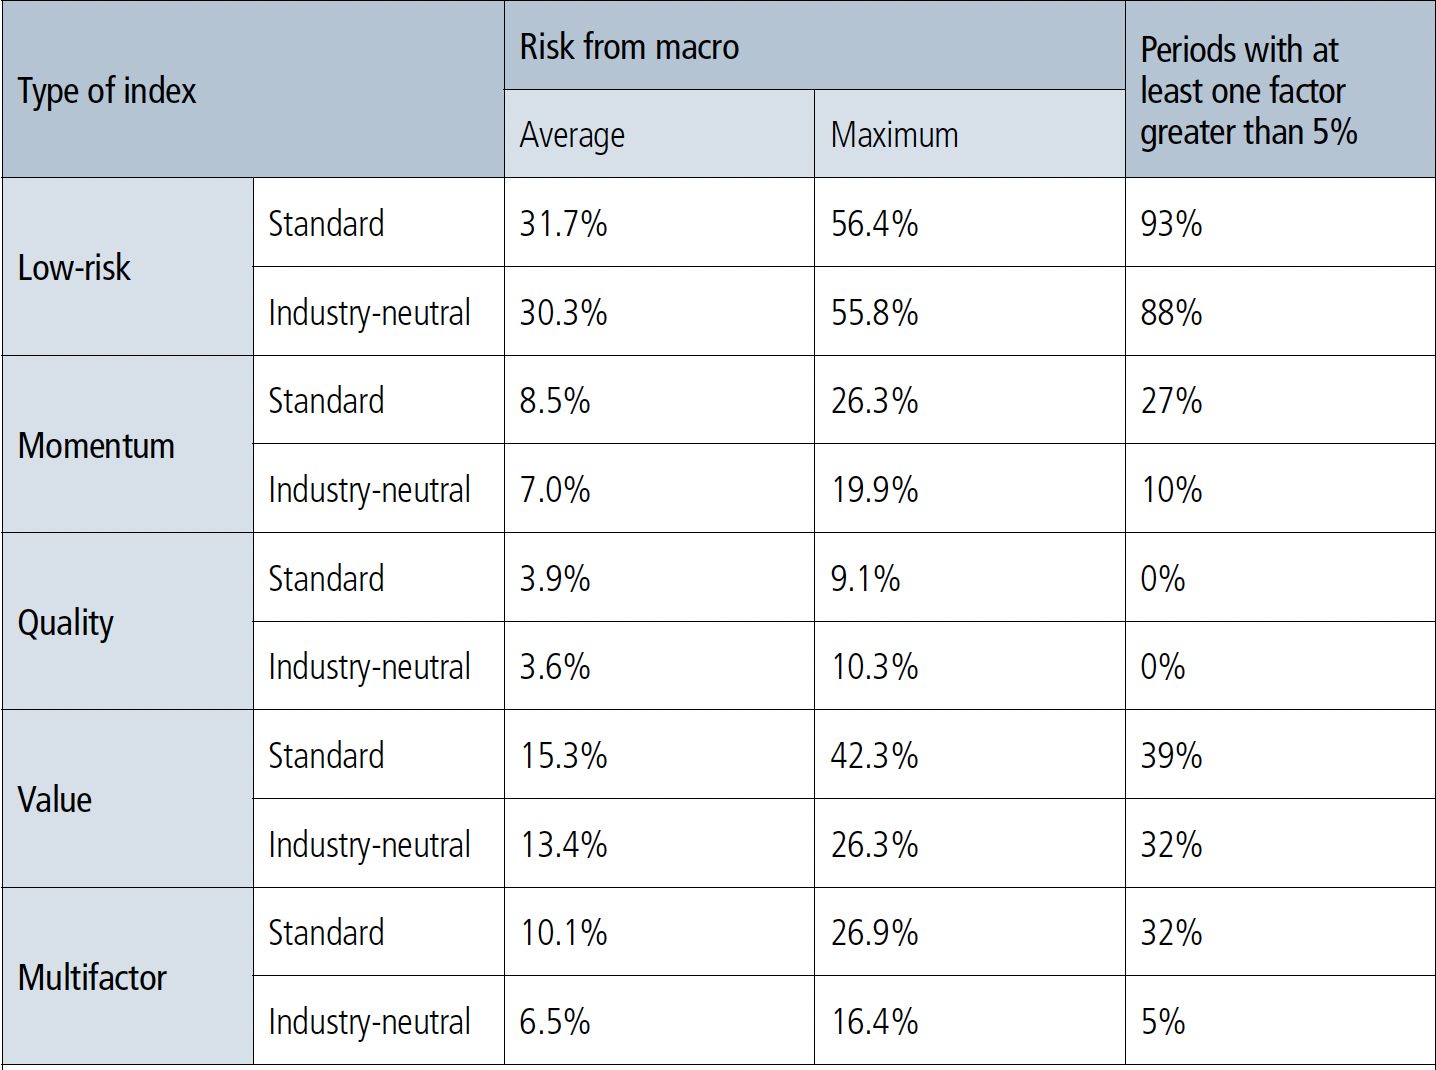
The high exposure to macro factors was consistent as well: we calculated the percentage of periods in which at least one individual macro factor accounted for 5% or more of the overall risk, and this was the case in 93% of the periods for the standard index and 88% for the industry-neutral index. In most periods, more than one factor contributed more than 5% of the risk, but this was not the case for the other style indices.
Quality — which tilts on high-profitability and low-leverage names — fell at the opposite end of the macro risk spectrum, with an average contribution from macro factors of 3.6%-3.9% and a maximum of approximately 10%. There were no periods for either version in which any factor contributed more than 5%. This suggests that both indices were much less vulnerable to changes in the economic environment as compared with the others.
Momentum fell between those two extremes, with 7%-8.5% of risk, on average, coming from macro factors. The contribution reached as high as 26.3% for the standard version, although it was only about 20% with industry constraints.
Value had at least one macro factor contributing significantly to its risk more often than the other indices (except Low Risk). While the average macro contribution was only 13.4%-15.3%, it reached as high as 42% in the standard index, but only 26.3% when industry exposures were constrained.
Finally, the standard Multi-Factor index averaged about 10% of its risk from macroeconomic factors, although it reached as high as about 27%. At least one individual factor accounted for 5% or more of the risk about one-third of the periods. The impact of industry neutrality was bigger for Multi-Factor indices than for any of the single-factor indices, dropping the average risk contribution to 6.5%, the maximum to 16.4% and the number of periods in which the 5% threshold was exceeded by one factor to just 5%.
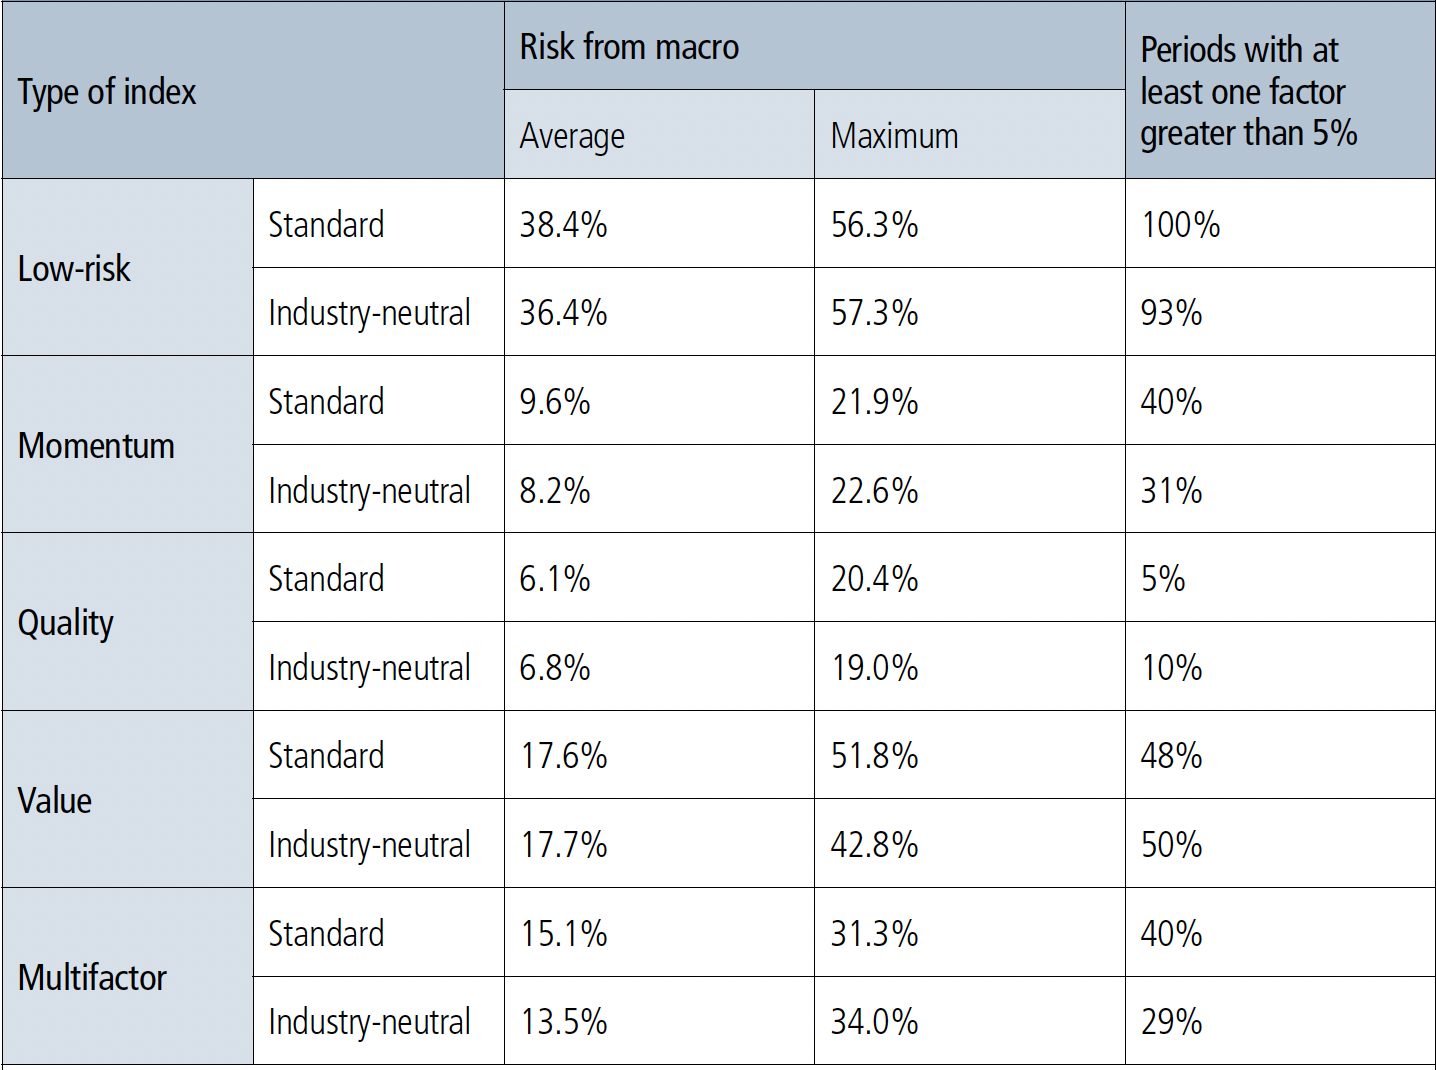
We also calculated the same set of statistics for factor indices built on the STOXX® Europe 600 index (Exhibit 3). Almost all the statistics show a higher sensitivity to the macro economy in Europe compared with the US, and we still see that imposing industry constraints reduces sensitivity.
Exhibit 3 – Summary statistics, STOXX Europe 600 style indices
Conclusion
Style indices and portfolios may engender more macroeconomic risk than investors realize, but that can change over time and based on the specifics of the index. In addition, limiting industry exposures can reduce the macroeconomic risk exposures of a style portfolio[3]. We note that when industry exposures were constrained:
- The average contribution from macro factors was lower
- The maximum exposure was lower (except for Quality)
- The number of periods in which one or more factors contributed at least 5% of the risk was lower
The impact of industry constraints was biggest for Value and Multi-Factor, followed by Momentum. We also note that our Quality indices had relatively little macro risk exposure, but it was occasionally high enough that investors may want to, at least, be aware.
* Melissa R. Brown, CFA, is Managing Director for Applied Research at Qontigo.
[1] STOXX offers three suites of global factor indices that use Axioma style models: the standard Factor indices, the Industry Neutral Factor indices and the Equity Factor indices.
[2] An astute observer might notice that the charts still show active risk from industry exposures, even for the industry-neutral indices. That is because the risk model uses finer industry designations than does the portfolio construction process, so there may be active weights in sub-industries even if there is no exposure to the parent industry.
[3] Although this analysis was restricted to US indices, we saw similar results from our European factor index suite.


