

According to the returns for Axioma’s factors, the first quarter of 2019 was probably a tough one for many systematic, factor-based investors, especially those investing in the US. Across most regions we track closely returns were negative for Medium-Term Momentum, Value, Low Volatility and Low Market Sensitivity (beta). The quarter’s results were more mixed regionally for Profitability, Earnings Yield and Size (where large-cap stocks tended to dominate), and Growth fared well, except in Canada and Australia. It was also a quarter in which more-liquid stocks substantially outpaced their lower-volume counterparts (Exhibit 1).
The US stood out with the highest number of factors that produced results in the opposite direction to what one would expect. Put another way, the expected benefit of diversification across multiple factors did not seem to pay off, with portfolio returns further pummeled by the highly negative performance experienced by Value and Profitability, both of which saw returns that were at least two standard deviations below the long-term average (based on expected volatility at the beginning of the quarter for the US all-cap universe). And while Japan had fewer factors with returns that ran counter to expectations, it had the highest proportion of those that fell more than two standard deviations below average.
Exhibit 1. Q1 2019 Factor Returns
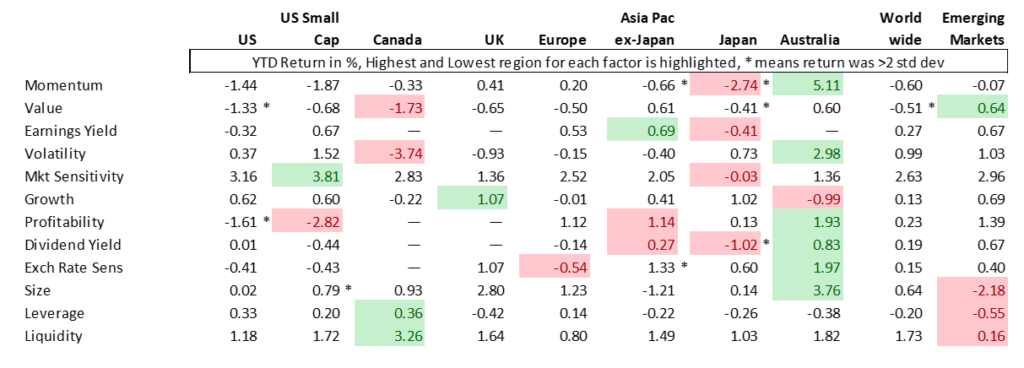
Many US factors had also experienced a tough fourth quarter last year, but there was one major contrast in Q1 2019 versus Q4 2018. In Q4 many factors saw far more outsized daily returns than one would have expected given the beginning-of-day risk forecast*. In Q1 most factors had a far lower proportion of outsized daily returns than in Q4. The exception was Market Sensitivity, which saw big returns in more than 8% of the days. One might expect higher-beta stocks to fare unusually well in such a strong market, but there were also a few days in which the return was highly negative.
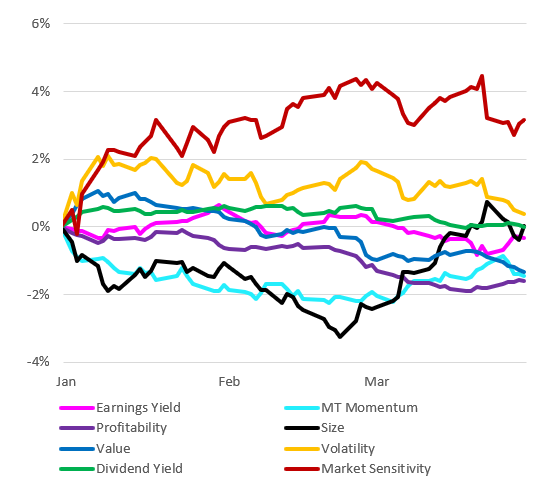
For some factors the full-quarter return masks some underlying volatility. Most notably Size turned in a highly negative return for the first half of the quarter, before rebounding sharply when the market started to favor large-cap stocks (Exhibit 2). Momentum also had it rough the first two months before it rebounded in March. And the very positive return to Market Sensitivity also came in the first two months. Others, such as Profitability and Value, saw steady deterioration.
Exhibit 2. Q1 2019 Cumulative Factor Returns, US4 Model
The back-and-forth in daily returns for some factors also meant some big changes in their correlations with other factors – an important driver of changing portfolio risk for those who invest across the factor spectrum. While the median pairwise correlation of all factors saw little change, certain pairs became much more or less correlated. The table below highlights factor pairs for which the magnitude of the change in correlation was 0.3 or more. A manager betting on Dividend Yield and Profitability, say, would have realized a much bigger diversification benefit as the correlation between the factors fell from 0.35 to -0.12, whereas a bet on Growth and Low Volatility would have resulted in less diversification.

Note: To calculate the correlations, we used the inverse of Market Sensitivity, Size and Volatility, so that a positive return would reflect the expected performance of all factors.
Conclusion
In our experience, drawdowns across many factors typically do not bode well for the market. We think there may be something bubbling under the surface that led investors away from bets that typically pay off in a given direction. Of course, we could also just be looking at the collateral damage from an unusually strong market. On the plus side, however, many of these factors tend to revert to their usual pattern of performance after a drawdown, so despite the disappointing quarter we remain faithful in the efficacy of many of these factors to compensate investors, as well as the ability of the full set to forecast active portfolio risk.
*We would expect to see, and have recorded, returns outside the 2-standard-deviation band about 5% of the time. We will discuss these findings in depth during the Axioma Insight™ Q1 2019 Risk Review Webinar on April 10th. Save your seat today!


