

Between February 19 and March 23, 2020, the STOXX USA 900 index plunged some 32% in just 23 trading days. After bottoming out on March 23, it has since rebounded some 30% in 18 days! And that raises a host of questions. Did investors overreact in March? Are they overreacting now? What was investor sentiment in the quarter leading up to the event, and were there any early warning signs? Was the sharp March market correction justified by investor sentiment at the time? Has sentiment recovered since? And what is current sentiment telling us about the recent market recovery?
To answer these questions, we used the Qontigo ROOF Scores[1] to track investor sentiment before, during, and after the coronavirus-sparked market rout of February-March 2020. Specifically, we analyzed investor sentiment in the following periods: from the start of Q4 2019 through to the market high on February 19, 2020; during the market rout itself, from February 20 through to March 23, 2020; and during the current recovery rally, from March 24 through to April 17, 2020.
The Qontigo ROOF Scores were developed as a sentiment indicator, that is, a quantification of investors’ confirmation bias, i.e., are they bullish, bearish or neutral? We compute the level of risk tolerance (bullish) and risk aversion (bearish) in the market daily. The ROOF Score is simply the net difference between the demand for risk (risk tolerance) minus the supply of risk (risk aversion) in the market, and represents the overall risk appetite among investors. We have developed two variants of the ROOF Scores, one based on style factor returns, the other on sector portfolio active returns versus the benchmark. The correlation between the two is about 0.80.
Figure 1: October 1, 2019 through to February 18, 2020
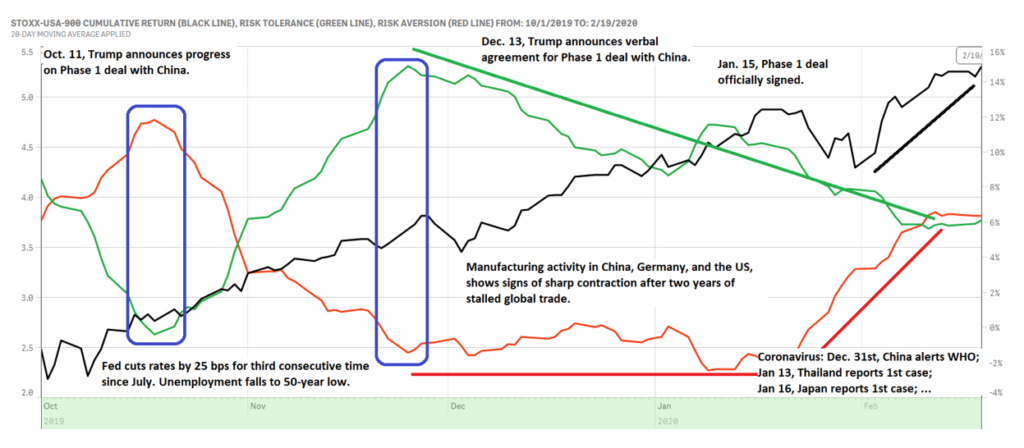
Figure 1 shows the cumulative return of the STOXX USA 900 in black, the level of risk tolerance in green, and the level of risk aversion in red, from October 1,, 2019 through to February 29, 2020, using the style-based version of our ROOF methodology. After spending most of the summer of 2019 at equilibrium (similar levels of risk tolerance and risk aversion), investors began to worry about the impact of the two-year long US-China trade war on the global economy, which had already forced the Fed to cut interest rates by 25 bps twice (in July and in September). This was reflected in a declining level of risk tolerance (green line) and a rising level of risk aversion (red line) from mid-September to October 10, 2019. By the time of his press conference on October 11, 2019, Trump was facing a net bearish sentiment. The announcement that the US and China had agreed on a framework for restarting the trade negotiations served to deflate investors’ risk aversion (red line) and refocus their attentions on the strong economic fundamentals (e.g. unemployment hit a 50-year low). By November 25, sentiment had completed a 180-degree turn and was overwhelmingly bullish.
On December 11, the Fed (Powell) announced that there would be no further rate cuts until 2021. Simultaneously, manufacturing data showed disturbing pockets of weakness in China, the EU and the US. This led to a slow decline in risk tolerance (green line) from November 25 onwards. Contrary to the manufacturing side, the US consumer was showing no signs of slowing down. This allowed the level of risk aversion (red line) to remain flat, leading to a ROOF Score that simply became progressively less bullish, but was not yet turning bearish.
By early January, the coronavirus narrative begun to appear on the front pages of all major newspapers. China had alerted WHO on December 31, and both Thailand and Japan had reported their first domestic cases on January 15 and 16, respectively. By January 22, China had reported its fourth death in Wuhan and new cases in other cities. Taiwan, Hong Kong and the US were reporting their first cases. On January 23, WHO declared the outbreak a Public Health Emergency of International Concern (PHEIC). And that triggered a sharp increase in risk aversion (red line). By February 10, 2020, all the bullish sentiment from the Phase 1 trade deal had been erased and sentiment was back in neutral, where it remained until the market reached its peak on February 19, 2020.
Figure 2: November 25, 2019 through to March 23, 2020
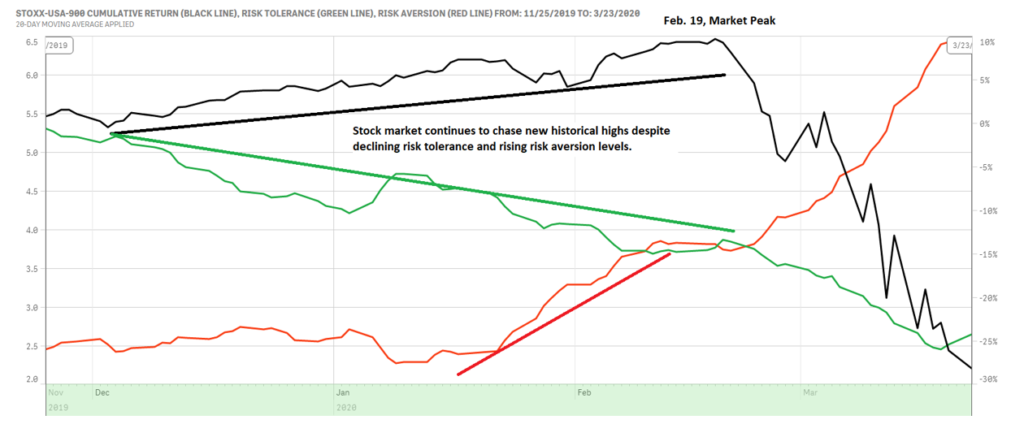
Figure 2 depicts the period of the market rout from February 19 through to March 23. This shows that since late November, and especially since January 22, the market was chasing consecutive new historical highs without the support of a bullish investor sentiment. Although sentiment had not yet turned bearish, the imbalance between risk chasers and risk avoiders had become too small for a sustained rally. By February 19, the world was in full pandemic-control mode and the news flow drove risk aversion continuously higher, while pushing risk tolerance steadily lower. By March 23, the imbalance between the demand (risk tolerance) and supply (risk aversion) for risk was the largest we have observed in the US since the global financial crisis. And just as in 2008, the Fed brought out its big guns.
Figure 3: January 3 through to April 9, 2020
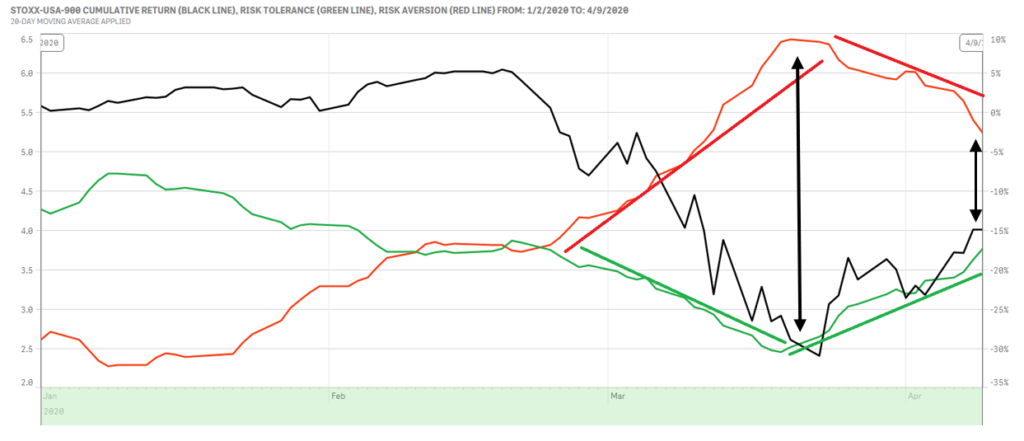
Figure 3 advances the timeline by another month and includes the recent recovery rally up to April 16, 2020. As shown, the help helped. Thanks to a strong monetary and fiscal response, risk aversion began to decline, and risk tolerance started rise for the first time since November 25, 2019. As of this writing, risk aversion is still above risk tolerance, but the trend is comforting. As we reach a neutral level in the next few days, the news flow is likely to once again drive investor sentiment, with earnings season kicking off and the start of economic data reports that will overlap the lockdown periods.
Recall that the ROOF Score is the balance between risk tolerance (the green line in the charts above), and risk aversion (the red line in the charts above). Given that investors can at times be a bit, well, emotional, we developed the ROOF Ratio to distinguish signals from noise when it comes to investor sentiment. The ROOF Ratio simply takes the average ROOF Score for the last 20 days, divided by its standard deviation. It was designed to measure if investors have the courage of their conviction.
Figure 4 below shows the cumulative return of the STOXX USA 900 index for the period of October 1, 2019 through to April 9, 2020, along with the style-based ROOF Ratio (blue line) and the Sector-based ROOF Ratio (green line). The green reference line at +0.5 denotes the level above which the ROOF Ratio gives a bullish signal, i.e., the imbalance between the demand (risk tolerance) and supply (risk aversion) of risk is largely in favor of risk tolerance. The red reference line at -0.5 denotes the level below which the ROOF Ratio gives a bearish signal, i.e., the imbalance between the demand (risk tolerance) and supply (risk aversion) of risk is largely in favor of risk aversion.
As mentioned above, the market rally for the first 19 days of February was in denial of a fast-declining risk appetite. The sector-based ROOF Ratio (green line in Figure 4) dropped out of the bullish zone and into the neutral zone in early December 2019 (1 in Figure 4) and moved into bearish territory on February 11 (3 in Figure 4). The style-based ROOF Ratio took an extra month to cross into neutral territory (2 in Figure 4), and eventually into bearish territory as well (4 in Figure 4). A neutral risk appetite is hardly supportive of cumulative attempts at historical new highs. When the balance between risk tolerant and risk averse investors is at equilibrium, neither side can extract a large premium or discount from the other when exchanging risk assets, therefore we would expect a sideways market with low volatility during those times. This inconsistency in the direction of investor sentiment and market return was not sustainable, even without the coronavirus narrative. A correction was overdue. And a correction we got, commensurate with the plunging depth of sentiment through March 23, 2020.
Figure 4: January 3 through to April 9, 2020
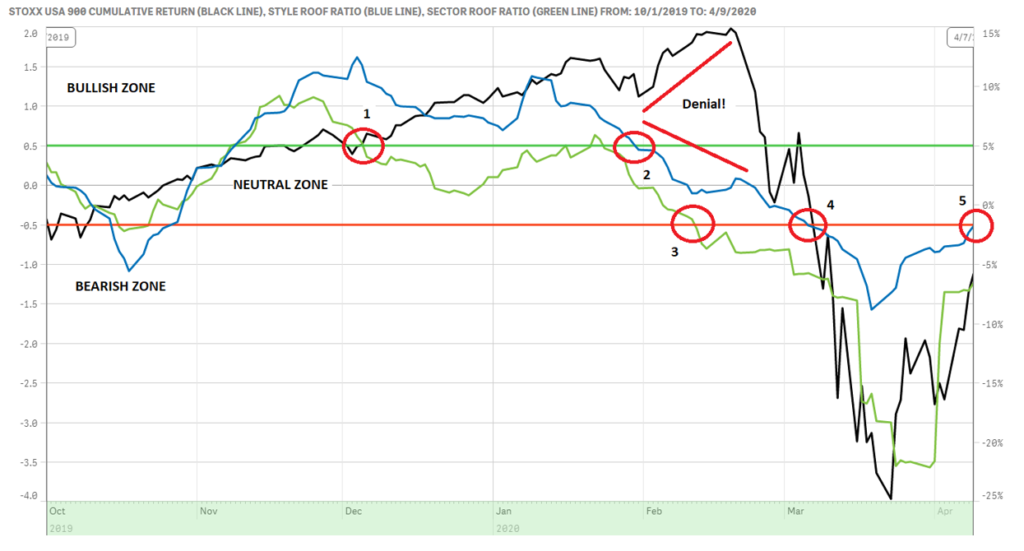
Since then, however, sentiment has recovered and both ROOF Ratios are now back in the neutral zone (5 in Figure 4), waiting for direction from full-year earnings guidance from CEOs, and March economic data releases, with the coronavirus daily updates in the background. Despite the strength of the recent recovery rally, investors are not bullish by any means and remain at the bottom of the neutral zone. And while the imbalance between risk tolerance and risk aversion is closing fast, at these levels, they remain more fearful of the downside risk than hopeful of the upside potential. A return to a neutral confirmation bias has supported a 50% retracement of the recent market fall, but it will take a strong move upward from here to get a full retracement. CEOs should choose their words carefully — rarely will they carry such weight on investor sentiment and the future direction of markets.
[1] ROOF stands for risk-on/risk-off. It is a sentiment indicator designed to track investors’ risk appetites.


