

This article was originally published on Responsible Investor.
Sustainable investing strategies vary. Some investors, for example, simply want to improve ESG alignment. Others seek to maximize their impact on society, by investing in those companies that contribute the most to certain goals. While the metrics that underlie these approaches have some overlap, there is not perfect correlation, in terms of how metrics are defined, how portfolios are constructed, what is being targeted, etc.
When it comes to improving ESG alignment, one popular method for sustainable portfolio construction is to use ESG ratings from one or more vendors. The manager may eliminate the worst offenders from a portfolio based on individual or composite ratings, tilt more heavily on the best companies, or both. Sometimes the criteria will include a reduction in carbon emissions. In most cases the portfolios are designed to hew closely to the market—in other words, limiting tracking error.
Investors can now target their desired impact using the Sustainable Development Investments Asset Owner Platform, which was recently formed to help managers and asset owners better understand how companies contribute to society. As the name implies, the focus is on sustainability, but rankings are based on revenues that come from concepts such as reducing poverty, promoting education, providing clean water, etc.
The process1 defines companies as majority SDI, decisive SDI or non-SDI, based on how their revenues map to the 17 UN Sustainable Development Goals. Many companies may sport favorable ESG scores but be defined as non-SDI, because the criteria used for each can differ widely. For example, while a company with strong governance may rank highly on an ESG scale, its products may not contribute to any of the goals set by the SDI. Therefore, it could figure prominently in an ESG index, but be considered non-SDI.
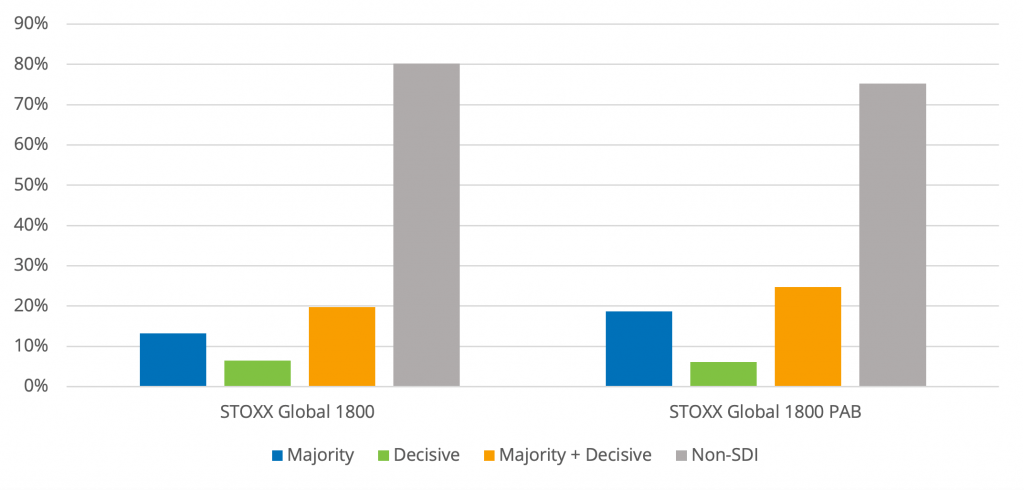
One area of intersection is in indices designed to encourage companies to reach net-zero-emissions targets, e.g., Paris-Aligned Benchmarks (PABs), which focus on reducing carbon emissions. Using one such index we can illustrate the overlap between a carbon-reduction portfolio and its inherent success in achieving SDI goals. Using the STOXX Global 1800 PAB, we calculated the portfolio weight in each category, and then compared the results with those using just the STOXX Global 1800. We found a 41% increase in the percent of the market value that ranked either majority or decisive2 for the PAB versus its parent, and a corresponding 6% decrease in non-SDI names. While this certainly is a move in the right direction for those wanting to make sure their investments have impact, the portfolio is perhaps still a little too heavily weighted away from companies achieving SDI goals, as even the PAB had 75% of its weight in non-SDI names. And although we do not illustrate it here, relatively few of the SDI goals were met.
Exhibit 1. Portfolio Weights in Each SDI Category, STOXX Global 1800 versus STOXX Global 1800 Paris-Aligned Benchmark
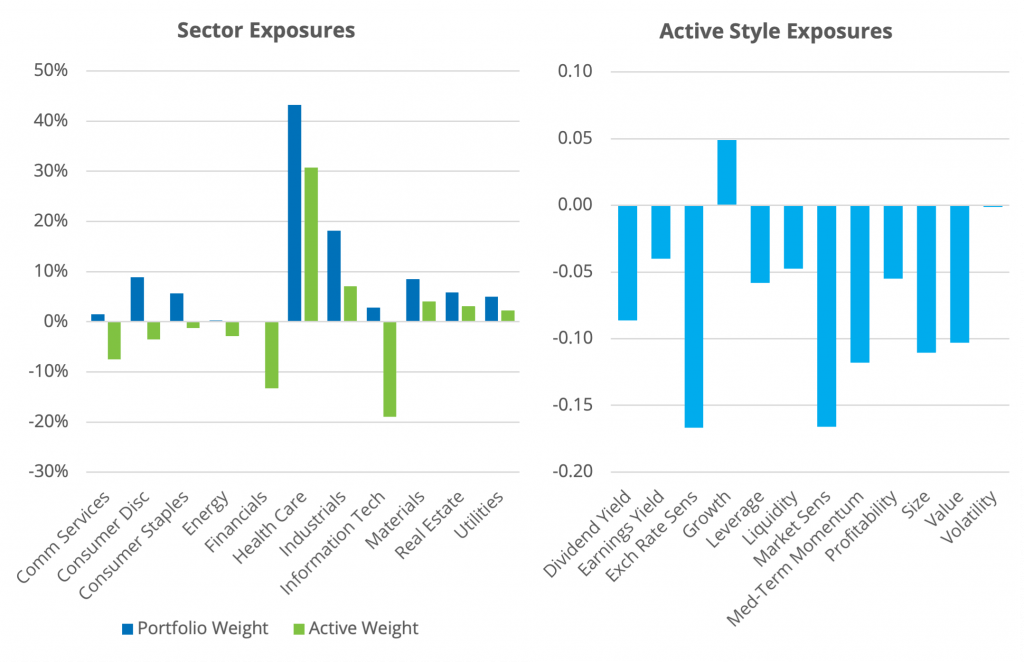
For our next experiment, we ran a quick study in which we started with a broad global developed market index(iSTOXX World-A), extracted only names ranked majority or decisive in the SDI scheme, and rescaled their weights to add to 100. While this was the surest way to ensure the portfolio reflected the SDI goals, this portfolio presented some issues. For starters, the 339 names comprised only about 18% of iSTOXX World-A. Moreover, the SDI portfolio had high tracking error to the underlying index (4.5%), and some significant style and sector exposures—for example, the portfolio was 30% overweight in Health Care—along with low volatility and low market sensitivity tilts. As many investors do not want to stray too far from the market, these exposures may introduce too much risk.
Exhibit 2. Sector and Style Exposures, Pure SDI Portfolio
So, the carbon reduction index was a little too “cold” in terms of achieving SDI goals, and the SDI-only portfolio was a little too “hot” in its risk characteristics relative to the market. The question now became, could we find a balance that was “just right”?
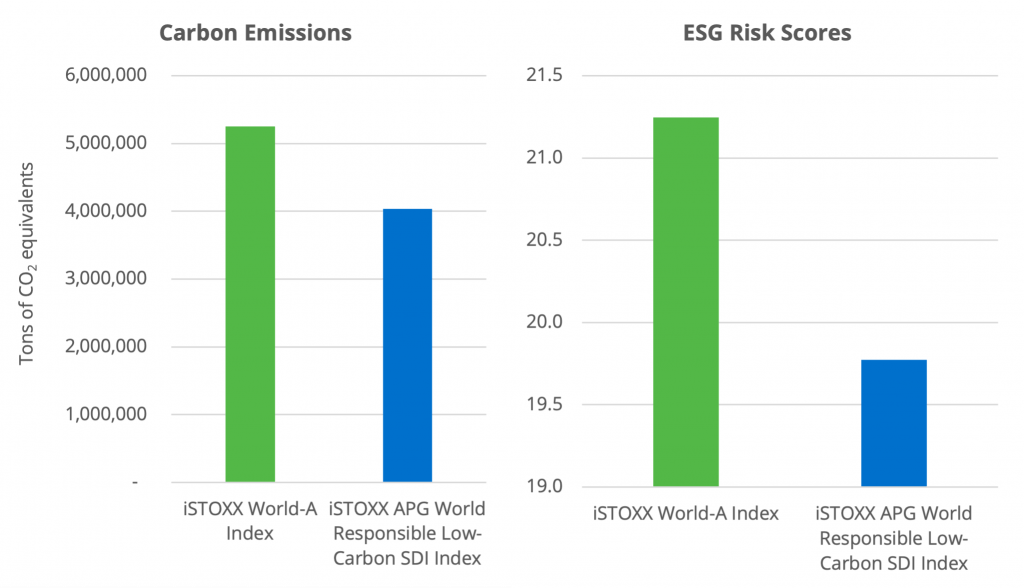
Enter the iSTOXX APG World Responsible Low-Carbon SDI Index, created using APG’s sustainability content, including one derived from the SDI AOP data and constructed using Qontigo’s portfolio optimization capabilities. The goal of the optimization is to maximize SDI exposure, while excluding non-ESG-Leaders, incorporating carbon reduction goals, and minimizing tracking error versus the iSTOXX World-A Index. As of May 31, 2021 the portfolio held 817 names and had just 1% tracking error versus its parent index. Active style and sector exposures were minimal, while the portfolio had a better overall ESG score, lower carbon emissions and higher SDI scores than the parent index.
Exhibit 3. Sector and Style Exposures, iSTOXX APG World Responsible Low-Carbon Index vs. iSTOXX World-A Index
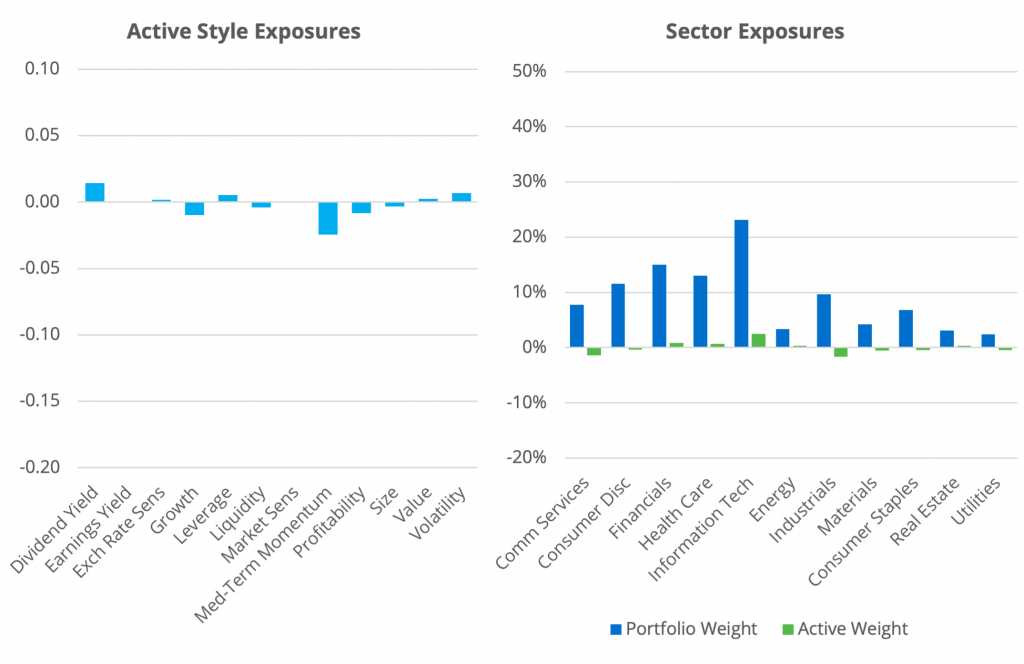
Exhibit 4. Sector and Style Exposures, iSTOXX APG World Responsible Low-Carbon Index vs. iSTOXX World-A Index
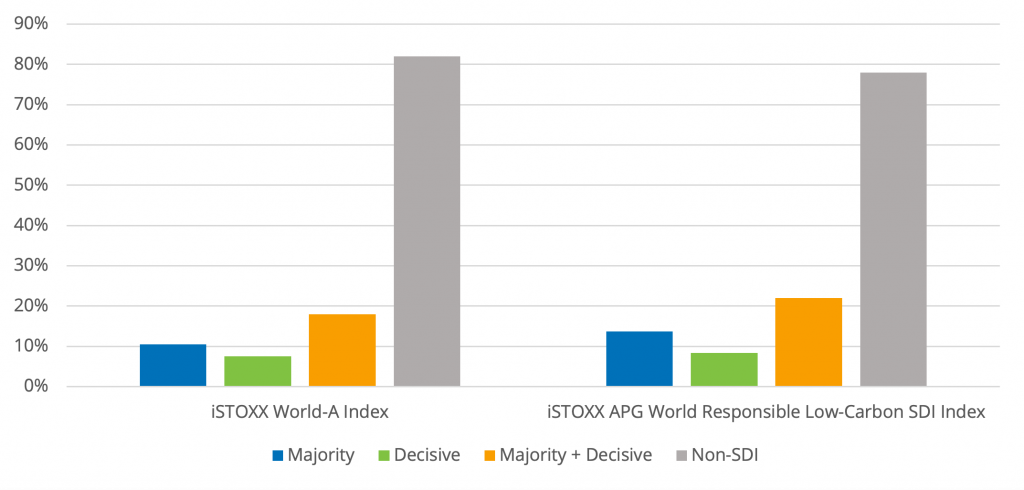
The improvement in the capitalization covered by majority and decisive names was 22%, with both sub-categories seeing improvement, and there was a 5% reduction in the non-SDI weight. Although their improvements were not quite as large as we saw from the PAB versus its parent, they were achieved with about half the level of tracking error.
Exhibit 5: Portfolio Weights in Each SDI Category, iSTOXX World-A Index versus iSTOXX APG World Responsible Low-Carbon Index
Conclusion
Investors seeking to leverage the power of their investments to make the world a better place inevitably face tradeoffs (as, of course, do all investors). The goal of maximizing SDI exposures comes at the expense of substantial deviation from the market in terms of sector and style exposures—and not all investors are comfortable with those differences. One can incidentally meet some sustainable development goals with an index like the STOXX Global 1800 Paris Aligned Benchmark, but that may only provide exposure to a small proportion of the goals. The iSTOXX APG World Responsible Low- Carbon SDI Index is one way that investors can find that “just right” combination of many SDI goals, carbon reduction and minimal deviation from the broad market.
[1] As defined by the SDI AOP Design Authority and implemented by Entis.
[2] Interestingly, while the market value of majority-ranked companies increased by more than 50%, the value of those ranked decisive fell by almost 9%.


