

Is one global model sufficient to manage the risk of a global equity factor portfolio? Yes, but because factors behave differently by geography, we believe a model that is aware of these variations can do an even better job of identifying, and therefore managing, active risk.
Axioma’s Worldwide Equity Linked Factor Risk Model combines three regional models—US, Developed Markets ex-US (DMxUS) and Emerging Markets. In doing so, we create a single global model that recognizes, for example, that US Momentum, say, may have different returns than non-US Momentum, because of the composition of individual markets. This means the risk model can take advantage of lower correlations and leverage different levels of volatility between Momentum factors. For this study, to keep it simple we will focus on just two of the regions, US and DMxUS.
Factor Correlations and Volatilities Differ by Region…
The standard Global model (WW4) assumes Momentum is a Global Factor, measuring all global stocks on the same momentum scale, without reference to their home market. In Figure 1, however, we see that while Momentum returns are correlated, they are not perfectly correlated.
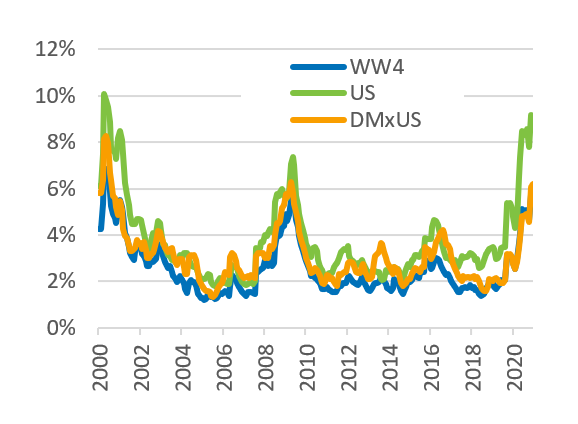
Factor volatility also differs substantially across regions at times and is almost always higher in the US than it is outside the US (Figure 2)[1]. Both US and DMxUS volatilities, in turn, are typically higher than what comes out of the WW4 model.
The differences in volatility suggest that the generalized WW4 Momentum Factor may underestimate the risk associated with Momentum when it is differentiated in the US and DMxUS, while the correlation differences could mean that an optimizer would miss a potential, albeit small, diversification opportunity.
Figure 1. Return Correlations, US vs. Developed Markets ex-US
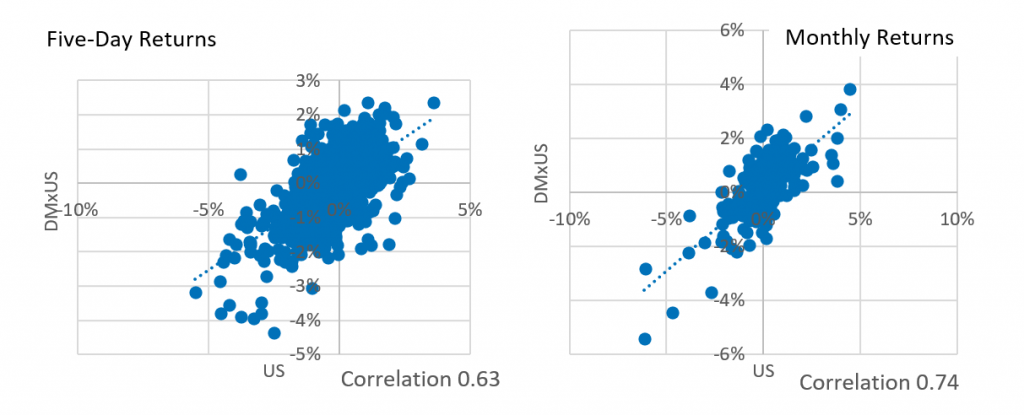
Figure 2. Momentum Volatility
…and Recognizing Those Differences Can Lead to Better Risk Forecasting
These observations led us to investigate if we could get a better risk forecast from a model that recognizes the differences just described. To illustrate the benefits of the Axioma Worldwide Equity Linked Factor Risk Model (LM4), we used the Medium-Term Momentum factor from the WW4 as the alpha input for a global portfolio. We then created optimized portfolios with both the WW4 model and the LM4 models, where we maximized exposure to the Momentum alpha. Our benchmark and investment universe was the STOXX Global 1800 index, and we targeted 3% tracking error at each monthly rebalance. Other than being long-only and fully invested, there were no other constraints. We ran our tests from January 2000 through December 2020.
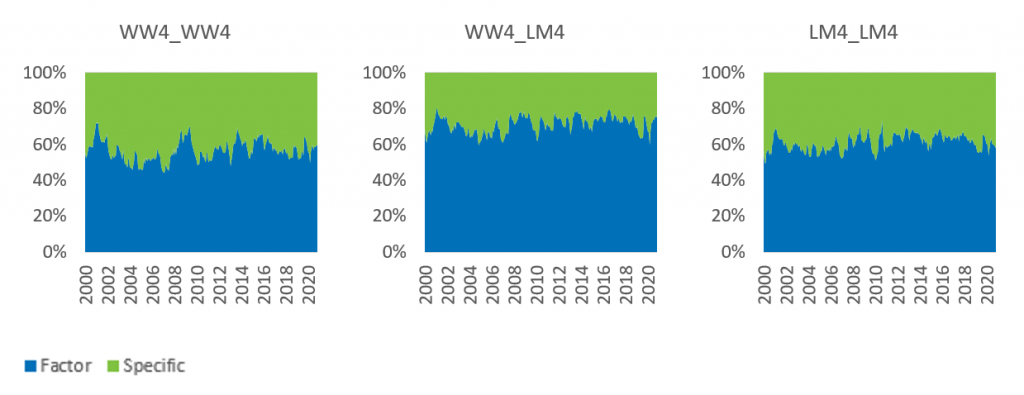
First, we conducted some basic ex-ante risk analyses. In Figure 3 we see that the portfolio constructed with the WW4 risk model and analyzed using that model got an average of about 57% of its risk from factors[2] and the rest was stock specific. That same portfolio had much more factor risk when analyzed using LM4, which was to be expected as the linked model “saw” the risks from the separate factors, especially the higher volatility of Momentum in the US. The portfolio optimized using LM4 had an average level of about 61% factor risk, also higher than the WW4-optimized version. However, factor risk using the LM4 model to optimize was lower than with the WW4 portfolio/LM4 risk analysis, as the optimizer[3] utilized the correlation structure of LM4 to diversify away more factor risk.
Figure 3. Breakdown Between Factor and Specific Risk
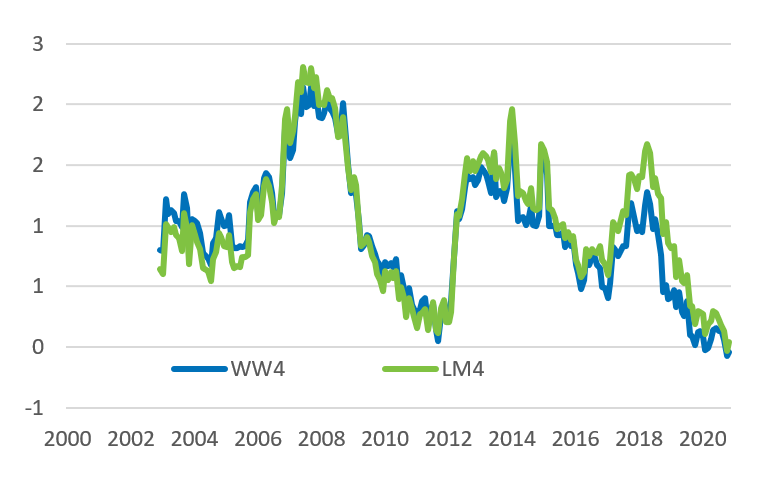
In general, the portfolio built using the WW4 model ended up with higher DMxUS and US Momentum exposures when evaluated through the LM4 lens than did the portfolio built using LM4, although there were times when they were very close (Figure 4). This is because the LM4 model recognized the individually higher volatilities (compared with Momentum’s volatility in WW4), and therefore may be helpful in producing a better risk forecast (we’ll see if this is the case shortly…).
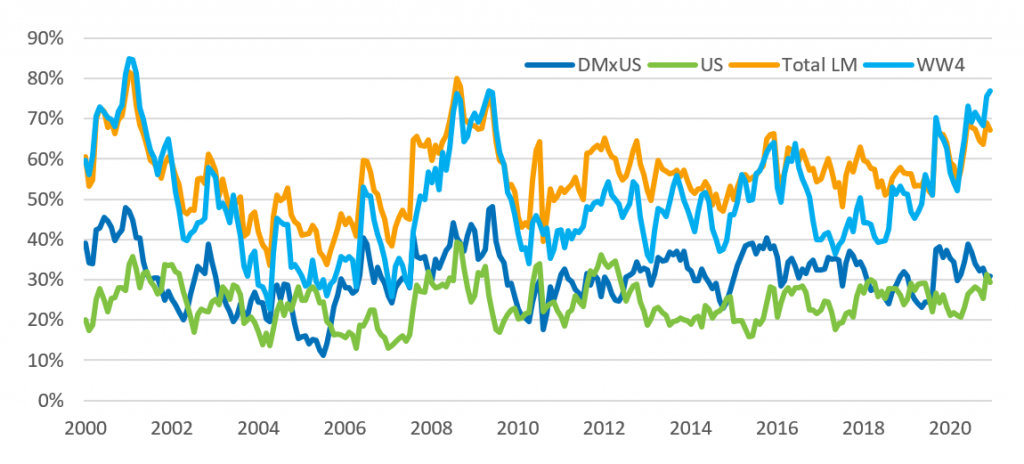
Figure 5 details the percent of variance represented by the Momentum factor. The “DMxUS” and “US” lines are from the portfolio constructed using the linked model, and the “Total LM” line is the sum of the two. The “WW4” line is the percent of variance from the Momentum factor in the portfolio constructed using WW4. The proportion of risk from outside the US was typically, but not always higher than that coming from the US. Their total, however, was often higher than the proportion in WW4, and very rarely lower. This suggests that the portfolio constructed using the linked model got more of what it was after, that is, ex-ante Momentum exposure.
Figure 4. Momentum Exposures
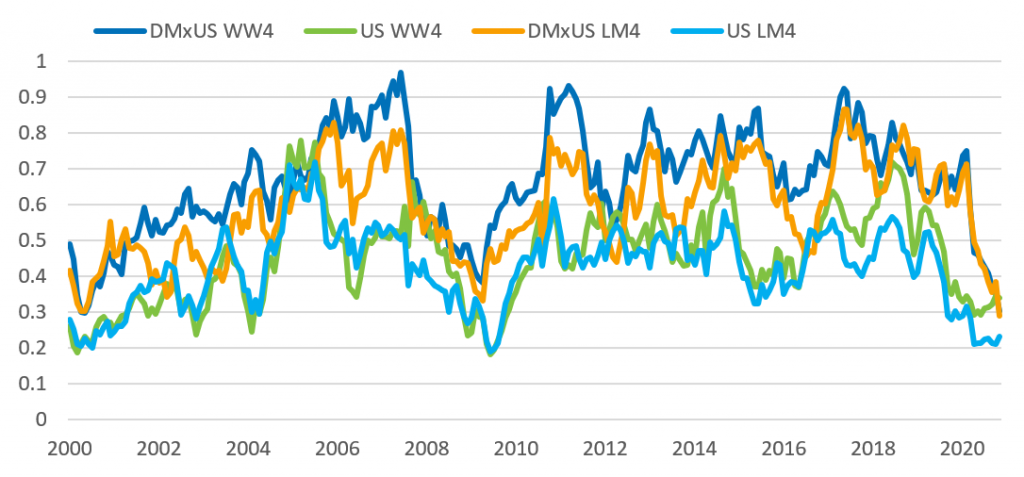
Figure 5. Percent of Variance From Momentum
Backtest Results Highlight Better Risk Forecasts and Smaller Drawdowns for the Linked Model
There are many other ways we could analyze the risk of our two portfolios, but it is time to cut to the chase. Over the course of the 20-year backtest, the portfolio constructed using WW4 returned 3.89% annually, whereas the one created with the linked model returned 3.64%. That said, the WW4 portfolio achieved that return with a realized tracking error of 4.42% and produced an information ratio of 0.88. At the same time, the linked-model portfolio realized a lower tracking error, 3.96%, and therefore produced a higher information ratio of 0.92. While the IR difference is small, realized risk was closer to target.
Of course, it is rare for any manager to have 20 years to prove his or her worth. In Figure 6 we see that realized tracking error over one- and three-year periods was almost always lower—and closer to the 3% target—for the LM4 portfolio, and Figure 7 indicates that the rolling three-year information ratio was usually higher for the LM4 portfolio as well. (They were much closer on a 12-month basis, though.)
Figure 6. Realized Tracking Error Over Rolling 12-Month and 3-Year Periods
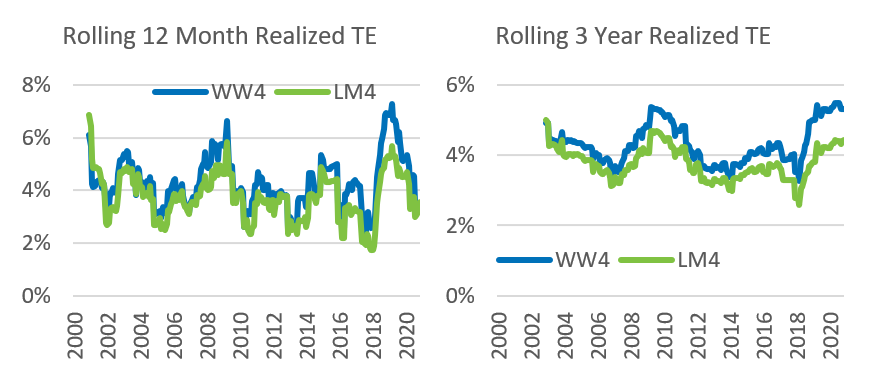
Figure 7. Rolling 3-Year Realized Information Ratio
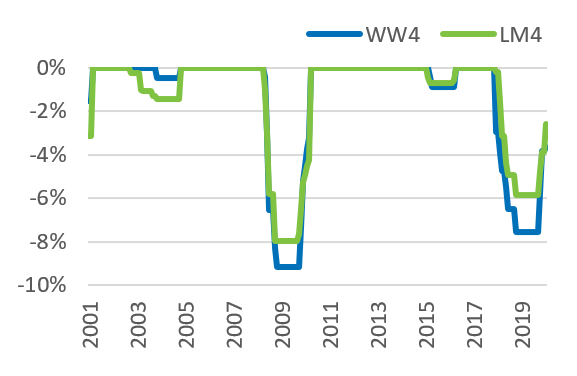
Finally, we address drawdowns. We know that almost any strategy goes through rough patches, and a Momentum-based strategy is certainly no exception. In the 20-year history of the backtests there were two severe periods of drawdown—the one that started with the market turnaround after the global financial crisis in March 2009, and the more-recent (but slightly less severe) one in late 2018 (Figure 8). In both cases the maximum drawdown was noticeably larger in the WW4 portfolio. In the smaller drawdown in 2015 the LM4 portfolio did slightly better, but WW4 did outperform in late 2003.
Figure 8. Active Return Drawdown
Conclusion
Having more factors in a risk model just for the sake of having more factors may not help a portfolio manager manage risk. But additional factors that allow the manager to fine-tune risk exposures are a definite plus, because factors that sound alike may not always behave exactly alike, thereby impacting the correlations and volatilities on which risk models rely. Here we have used a relatively simple example of creating a pure Momentum portfolio and were able to show that risk forecasts were more accurate, information ratios were slightly higher, and drawdowns were smaller when we used the linked model to construct the portfolio. Factors for which correlations are lower and volatility differences even wider might see even more risk-forecasting improvement. (In an earlier blog post we focused on Value.) There are numerous use cases for a linked model like this, and we will be writing about others in the coming weeks and months.
[1] This is probably because WW4 Momentum spans a bigger and more diversified universe.
[2] Factor risk was mainly from the Momentum bet, but since the portfolio was otherwise unconstrained, some risk from other factors was also present.
[3] Axioma’s Portfolio Optimizer


