

by Felix Fernandez, CEO & co-founder, OpenMetrics Solutions LLC.
Statistical analysis and probability theory have long focused on the problem of trying to detect turning points in financial markets.
If changes in the distribution of potential outcomes can be discovered, money managers can react ahead of potential market reversals and more sustained crises. As can be expected, an effective change point detection system relies on a strong mathematical analysis process.
The Bayesian Change Point (BCP) methodology is one of the most reliable concepts to early identify regime changes. The underlying mathematical methods were developed and tested in depth over the past five years at the Institute for Theoretical Physics at ETH (Swiss Federal Institute of Technology) in Zurich.1
BCP is part of a mathematical process that assumes that a dataset can undergo sudden changes in its dynamic at unknown positions. Through Bayesian inference every sample within the dataset can be associated with a change point probability. The data is processed so that it eventually yields a probability distribution. If new samples cannot be explained by the same probability distribution as the samples observed so far, the change point probabilities will be high.
A significant advantage of BCP is that it only uses the principal time-series as input. It also shows very robust results over many markets and over long terms without parameter modification. BCP has proved to be more reliable and faster than other mathematical models in recognizing market regime changes.
Case study in equity markets
In a recent study,2 OpenMetrics employed a BCP approach to determine change points for the STOXX® Europe 600 Index. The change points then became the basis for a dynamic hedge strategy that adjusts the equity exposure accordingly on a monthly basis.
The change point probabilities as a measure on whether the dynamics at a certain time are going to change and the estimation of the trend and the volatility based on those probabilities are the ingredients for a risk indicator.
The BCP algorithm produces signals based on the risk indicator ranging from 0 to 1. These were applied out of sample on index data between December 2005 and January 2018. Whereby, 0 stands for ‘high risk’ and 1 for ‘low risk.’ For example, a signal of 0.2 would call for only 20% of capital to be invested and 80% held in cash or other instruments.
The dynamic hedging helped improve the risk-return profile of the STOXX Europe 600 and is far more efficient than a passive hedging strategy of holding 50% in cash.
Table 1 shows the various measures resulting from the application of a dynamic hedge relative to holding the STOXX 600 and to passively hedging the index by 50% (50% in cash).
Table 1
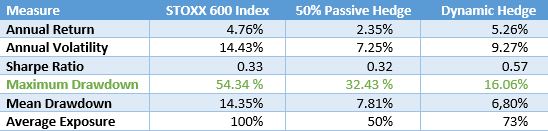
Perhaps more notably, the higher return with the dynamic hedge was produced with lower volatility and significantly smaller drawdowns, a characteristic of importance to investors.
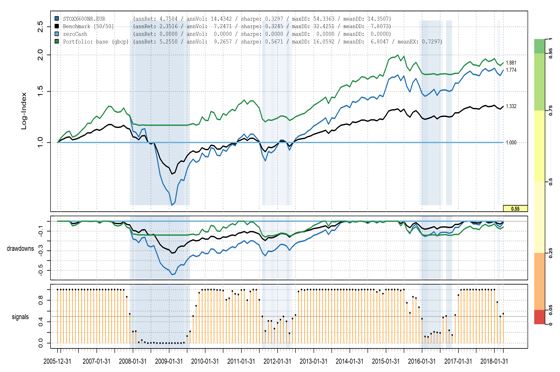
The top panel in Chart 1 shows the performance of the STOXX 600 Index (dark blue), cash (light blue), a passive hedge portfolio of 50% cash (black), and the dynamic hedge portfolio (green), between Dec. 31, 2005 and Apr. 30, 2018. The second panel displays the portfolios’ drawdowns and the third panel shows the signals produced by the algorithm.
Chart 1
A dynamic exposure management is key to achieving investors’ targets. By reducing drawdowns, capital is preserved in downtrends, enhancing long-term returns. This was particularly true in the case study, which covered the 2008 bear market. It can also bring down hedging costs.
The use of mathematical processes in advanced risk management systems and financial technology will likely continue to grow as their efficiency is validated and their use scope grows. Mathematical models such as BCP can be the basis for risk-management products, risk-control indices, portfolio monitoring and data analytics, among other uses.
About OpenMetrics Solutions
OpenMetrics focuses on advanced risk management methods and financial engineering. The company is a spin-off of ETH in Zurich, from which it sources the latest academic research.
Featured indices
1 T. Setz, ‘Stable Portfolio Design Using Bayesian Change Point Models and Geometric Shape Factors,’ Dissertation ETH Zurich No.: 24754, (2018).
2 OpenMetrics Solutions LLC, “‘Safety on Board’ How to Protect Equity Portfolios with Risk Signals Based on Bayesian Change Point Models,” April 2018.


