

Market makers and authorized participants (“APs”) in the primary market for ETF shares often need to hedge exposure to shares of ETFs that they must stand ready to convert into the underlying stocks in a “redeem” trade, or to shares of the underlying they must assemble in a “create” trade. When they deliver/accept the ETF shares to the fund sponsor, they will unwind this hedge.
Creating a hedge basket of stocks that matches the risk characteristics of the ETF constituents is often facilitated by a risk model, but most commercial third-party risk models have forecast horizons of 3-6 months or longer. Using such a model may mischaracterize the drivers of stocks’ volatilities and correlations over the very short-term horizon of the market maker.
Introducing the trading horizon model
We recently launched our first trading horizon risk model for the US market. The Axioma US Equity Factor Risk Model: Trading Horizon (Trading Model) is calibrated to a holding period of one month or less, and is far more responsive than standard risk models to changes in market structure and individual stock behavior.
We recently ran a test that naively simulates the market maker’s environment over one of the most volatile market periods in memory: the 50 days in early 2020 when news of the COVID-19 pandemic first hit, and then subsequently caused one of the steepest and most rapid drawdowns in stock market history. The nearly equally rapid recovery was highly concentrated in names that were believed to be “lockdown proof” while companies engaged in the physical delivery of services such as entertainment, travel, and leisure continued to suffer.
We used the Invesco QQQ ETF which tracks the NASDAQ 100 Index and is a popular retail and institutional trading vehicle, and normally quite liquid. We used both the Axioma US Equity Factor Risk Model – Short Horizon (Short-Horizon Model) (forecast horizon 1-3 months) and our new Trading Model (<1 month) to construct beta-neutral hedges to a $50mm “Creation Unit” of the QQQ.
This simulation was not necessarily meant to represent the actual process of how a market maker might hedge its exposure There are no transaction costs such as borrow rates being considered and the hedge is simply a basket of stocks identified by the risk model as offsetting to the systematic risks inherent in the ETF. It is meant to illustrate the dynamic nature of the new Trading Model and demonstrate that in a very rapidly changing risk environment, it pays to have a faster risk model that doesn’t rely as heavily on more distant past returns when forecasting over very short horizons.
Both the Short Horizon and the new Trading Model performed well in this test, but there is a clear advantage in the Trading Model’s result that we believe is worth exposing here.
The simulation
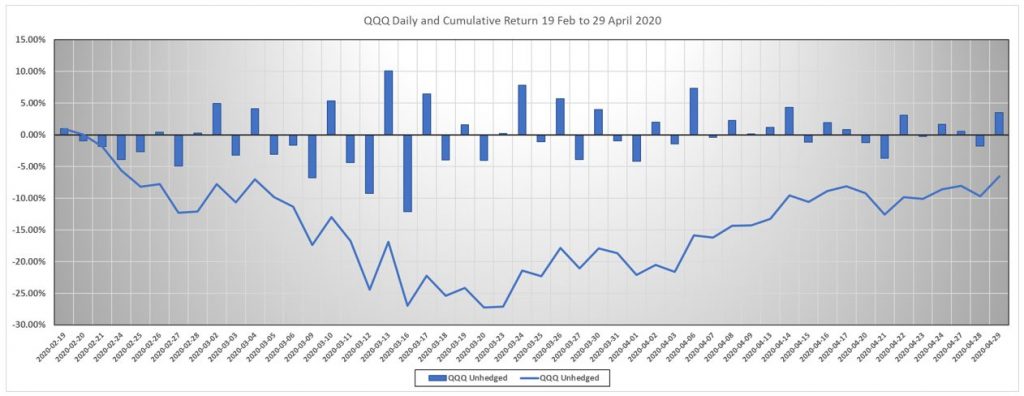
We hedged a $50mm position in the QQQ each trading day over the period February 19, 2020 to April 29, 2020 (50 days). The cumulative return of the QQQ over this time period was a loss of 6.53%, but with a max drawdown of -27.53% on the 20th of March. Included in this time period are daily losses of as much as 12.2% on the 16th of March and gains as large as 10% on the 13th of March:
We structured the hedge as follows:
- Objective: Minimize total risk
- Hedge universe: Single name stocks from STOXX® USA 900 index that are NOT QQQ constituents (roughly 800 names)
- Short only hedge up to 150% of reference value of $50mm
- Beta neutral (predicted beta) to STOXX USA 900 Index
- Linear penalty on additional specific risk
We ran the same hedging strategy employing both the Short-Horizon Model and the new Trading Model and compared results.
We are not so much interested in the cumulative performance of the hedged portfolio over the entire 50-day period, rather we want to concentrate on two metrics from the daily results of the hedging strategy:
- Since a hedged portfolio has an expected return of zero, we want to know whether either model got us consistently closer to a zero realized return than the other, and
- Since we do not expect to be compensated for any additional idiosyncratic risk we take on via the names in the hedge basket, does either risk model do a better job than the other at limiting the additional specific return coming from the names in the hedge?
The Results
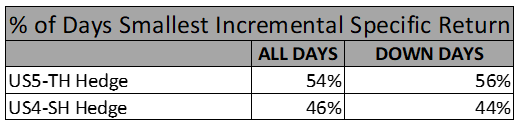
Interestingly, over these 50 days, there were exactly 25 up days and 25 down days. The results are as follows:
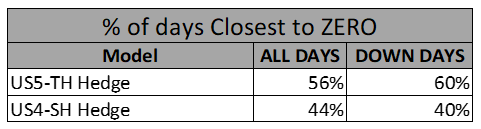
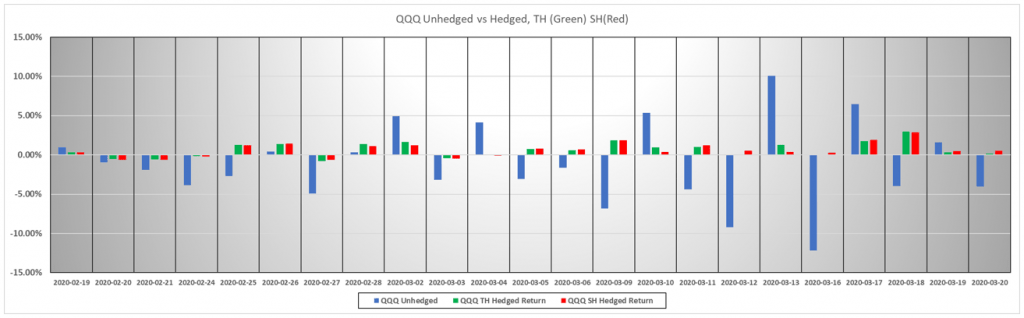
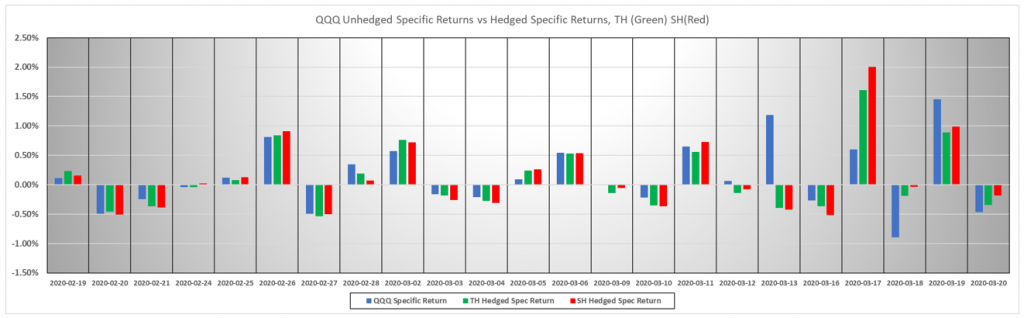
The Trading Model appears to be meaningfully better on a majority of all days and is superior on days when QQQ was down. We chart the daily results below:
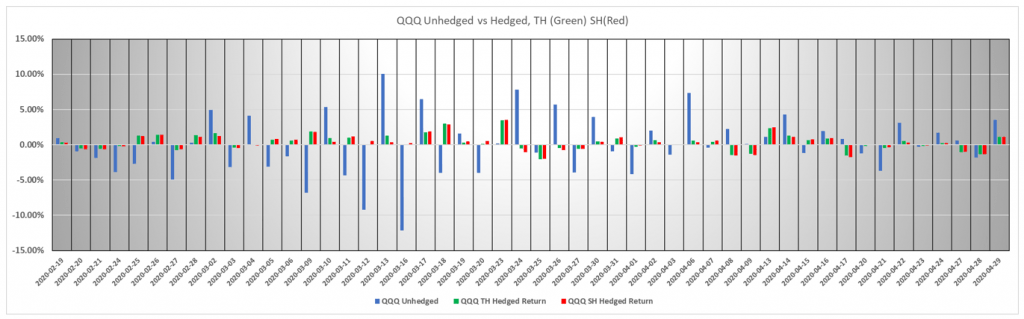
This illustrates that both models did quite well in hedging out the systematic risk of the QQQ, but the green bar is shorter than the red bar on most days, meaning that the net return of the Trading Model-hedged portfolio is closer to zero more often.
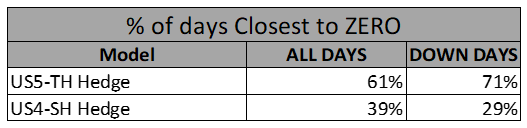
If we focus on the critical drawdown phase of the crisis, from the 18th of February to the 20th of March, the performance distinction is even more pronounced:
The second measure by which we will judge the performance of the risk models deals with stock specific, or “unsystematic” risk. It is not possible to eliminate entirely incremental specific risk from the hedge basket, but the penalty we place on incremental specific risk in the optimization will force the basket to be well-diversified in its own right without imposing position size constraints on the problem that might further detract from optimality. In this way, each risk model’s ex-ante forecast of the hedged portfolio’s specific risk will be as close as possible to the original, unhedged forecast. We simply seek to determine which risk model produces realized specific returns closest to the unhedged specific returns- that is, which model incurs the least realized uncompensated risk. The results are as follows:
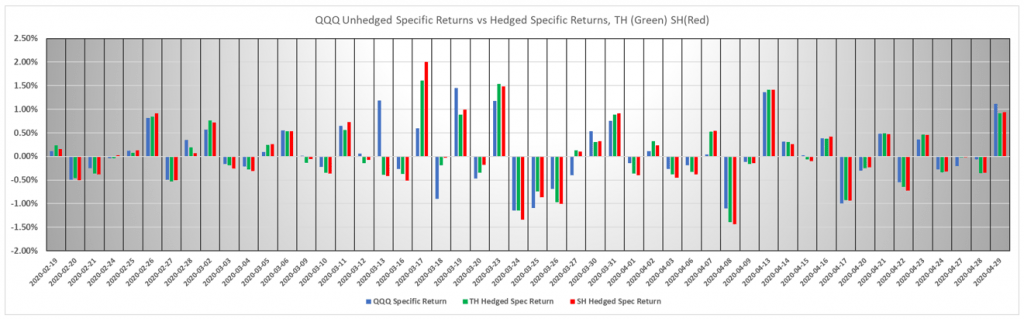
In the graphed results, we are looking for which of the green or red bars are closest in size to the blue bar each day. Over the full 50-day period, the Trading Model adds less incremental realized specific return, and does even better on the days the QQQ is down. When we focus on the February 18 to March 20 drawdown period, its advantage in this regard is a little less clear:
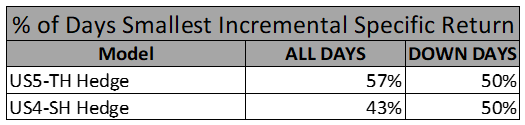
On days in the shorter period when QQQ was down, there appears to be no advantage to the Trading Model, but on all days, its advantage appears to be in line, if slightly better than when compared with the longer period above.
Changing betas and model responsiveness
One of the distinguishing characteristics of the COVID crisis in US markets was the abrupt change in perceived risk in cohorts of companies, which tended to line up well with industries that were predicted to do better or worse in a locked down global economy. This was particularly evident in the NASDAQ 100 index which the QQQ represents. The QQQ had significant drawdowns to be sure, but once it was understood by market participants that the internet commerce and technology services companies that make up the vast majority of that index would not be as affected, and might even thrive if everyone on the planet had to stay home for months on end, it’s relative riskiness compared to the broader US market changed dramatically. One of the reasons we believe the Trading Model may have outperformed the standard Short-Horizon Model is because of its responsiveness to this change. Below we illustrate the change in predicted beta from the two models juxtaposed with the cumulative returns of QQQ and the STOXX USA 900 index:
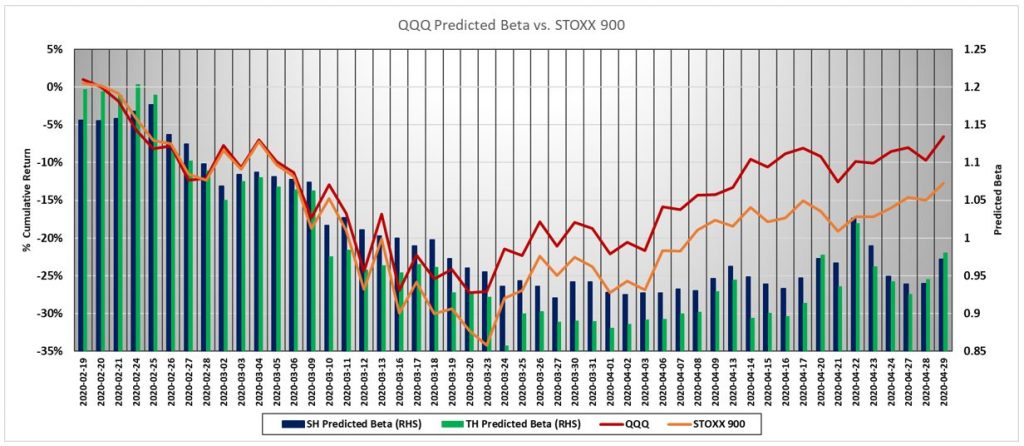
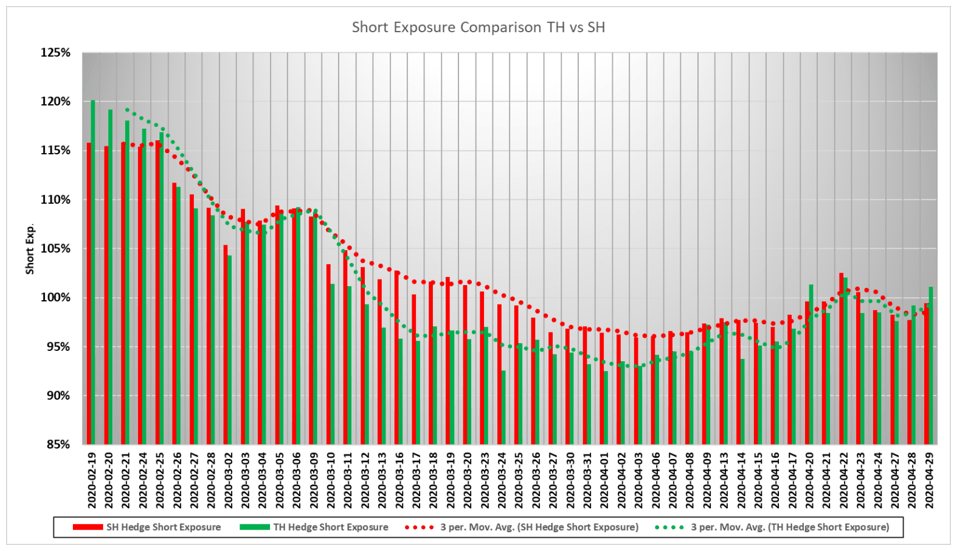
While both the Short Horizon and Trading Models show dramatic changes in the predicted beta of QQQ to STOXX 900, the Trading Model starts out higher and drops much lower as the difference in performance between the two indices widens. Given the beta-neutral constraint imposed on the hedge, it is likely that the Short-Horizon Model was over-hedging as risk began to come down in the QQQ towards the end of March. Here we show the Short Exposure taken by each model each day:
The Trading Model is purpose-built for portfolio construction and risk control of ultra-short term trading strategies. While this use case may be somewhat oversimplified relative to real-world trading and hedging scenarios, it crystalizes the distinction between the newer model and the standard US equity risk models without undo interference from external considerations- just the models’ risk forecasts versus realized results.
To learn more about the new Trading Model, visit qontigo.com/trading-model.


