

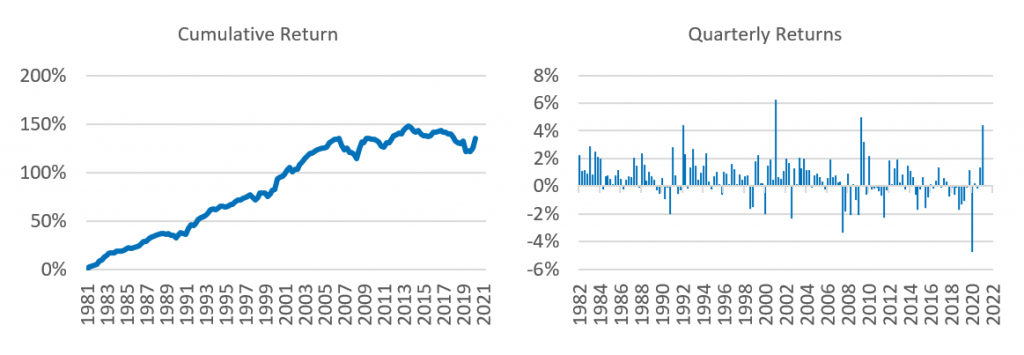
After experiencing a period of steadily rising returns from 1982 through 2006, investing in “cheap” stocks has been out of favor since 2007 (Exhibit 1). Granted, a few good quarters for the Value factor have popped up every now and again, but so have strings of poor performance, yielding a return of roughly 0% over the 13-year period ended September 2020. Since then, some performance ground has been reclaimed, but the factor still has a way to go to even each its previous high water mark. Not surprisingly, as performance picked up in the fourth quarter, questions of “why” and “for how long” were posed. While we are cautiously optimistic that the Value factor will continue to do well, we’re not about to ditch our own prom dates—just yet, anyway.
It has been a good period for Value lately. The return to the Axioma US Value factor[1] in the first quarter of 2021 was well more than two standard deviations above the long-term average, it was the fourth best since the model’s inception, and the best since the second quarter of 2009. The first quarter followed a strong, but not record-threatening performance in fourth-quarter 2020 (although still in the top quartile relative to history), producing the best two-quarter period since third quarter of 2009 and fifth best overall. These returns stand in sharp contrast to that of a year ago, when the quarterly return was by far the most negative in the history of the model.
Exhibit 1. Value Factor Returns, Cumulative and Quarterly
Value’s recent performance was better on the “long” side
Attribution analysis shows that the factor fared much better on the long side. In other words, cheap stocks took off more than expensive stocks stumbled. We see this in the contribution to overall return from the long positions in the factor-mimicking portfolio, which were up almost 13%, while the short positions fell more than 9%. We see the same in our “alternative attribution”, where the portfolio that could only be short up to the benchmark weight, but otherwise looks a lot like the factor-mimicking portfolio rose more than 5%, as compared with the 3.3% return for its counterpart that was allowed to short[2]. In a more “real-world” example, the STOXX USA 900 Ax Value index outpaced the STOXX® USA 900 by more than five percentage points. Overall, the long-side performance suggests that investors are betting on a strong economy that will benefit beaten-down stocks the most, and that is good news for a long-only portfolio manager or ETF investor.
The nature of Value is changing
Before looking at interest rates as the economic indicator, we looked at the characteristics of a Value portfolio. “Value” is typically thought of as being anti-growth and anti-momentum. After all, if a company is growing rapidly its stock is unlikely to be cheap. And if a stock has good momentum, its price increase may erase some of its value. To illustrate these bits of received wisdom, we looked at risk-factor exposures of our unconstrained Value Sample Factor Portfolio[3]. Without the sector and factor constraints of a typical long-only or factor-mimicking portfolio, we can see those parts of the market where we can find Value. After all, when Value stocks fare well, their Momentum should pick up, and occasionally the market underprices strong growth.
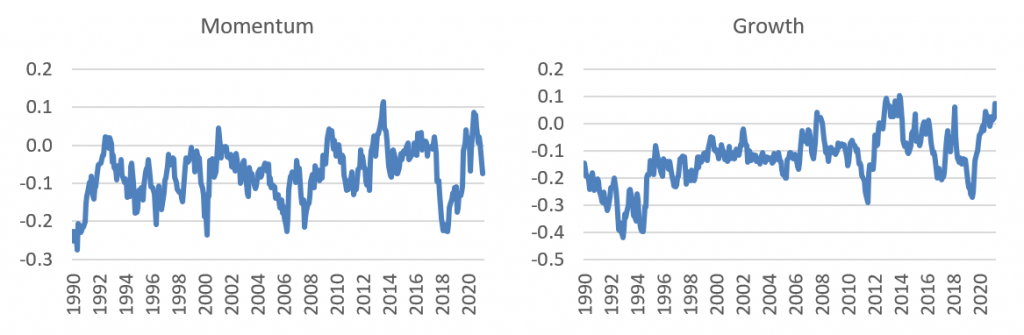
Over its 20-year history, our unconstrained Value portfolio’s active Momentum exposure has almost always been less than zero, confirming that Value is typically anti-Momentum (Exhibit 2). In September of 2020, however, the Momentum exposure of our Value portfolio reached a near-term peak, a level exceeded only once in the 20 years. This is interesting, as it happened before November’s substantial market rotation away from the “COVID Profiteers” to the stocks that were beaten up during the pandemic. Perhaps there was a stealth rotation starting at the time that ultimately became much more recognizable later in the year. By the end of March 2021, however, the portfolio’s Momentum exposure had faded, dropping back below zero to its long-term average. Therefore, it is difficult to make the case that US Value currently has strong Momentum.
The portfolio’s Growth exposure tells a different story. Until 2012 the exposure was consistently below zero. Since then, the Growth exposure has been volatile, bouncing between slightly positive and very negative[4]. The Growth exposure has climbed steadily for the past two years and ended the first quarter near its all-time peak. So at least for now, Value is not necessarily anti-Growth, at least the way we define Growth in our risk model. And although the performance of the Value factor was much better when the Growth exposure was negative, it is not clear that there is a cause and effect, and it seems that a higher Growth exposure should be a positive.
One final note on these two factors. In the first quarter, both Growth and Momentum detracted from the portfolio’s active return, albeit very slightly. We would be more enthusiastic about Value’s future prospects if the Growth exposure was negative, as it was during Value’s heyday, and if the exposure to Momentum was currently positive, suggesting some wind at Value’s back.
Exhibit 2. Unconstrained US Value Portfolio Exposure to Other Selected Factors
The economic environment—as signaled by interest rates—suggests a better future
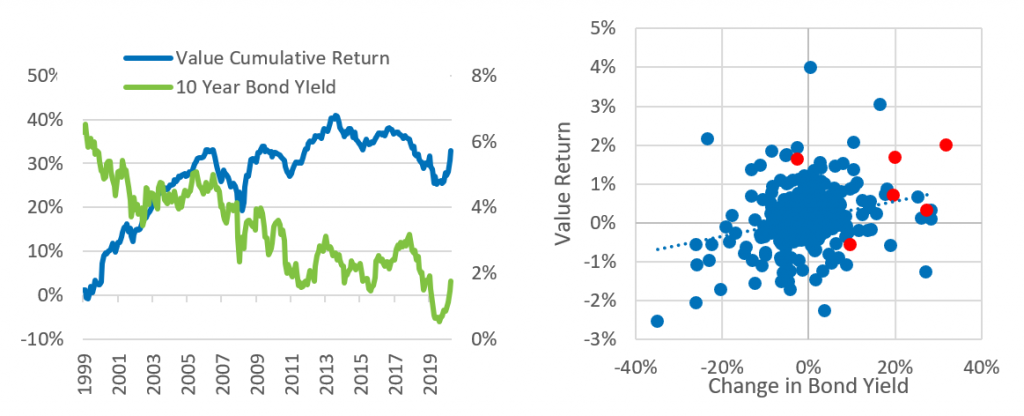
One clear characteristic of the recent equity market is the expected increase in inflation and corresponding rise in interest rates, and that has played into Value’s performance. Earlier in our study period, Value’s return was accompanied by rapidly and sharply declining 10-year bond yields (Exhibit 3). From the inception of our yield data in 1999 through June 2003, the yield dropped from 6.3% to 3.7% and Value’s return climbed steadily, up around 17%. For the next four years yields remained between 4% and 5%, while Value continued to perform well, up another 15 percentage points or so. Then came the global financial crisis and yields tumbled once again but so did Value, which never really recovered its mojo, until about six months ago. The chart on the right of Exhibit 3 is a scatterplot of monthly Value returns versus the proportional change in bond yield over the month. We wanted to see if a relationship exists between the two, as one might expect. As Christoph Schon has pointed out in recent blog posts[5], higher inflation and bonds yields can be viewed as positive aspects of a healthy and growing economy, unless the central bank feels compelled to tighten. Value would likely benefit from a growth environment but might tumble even more than the overall market when things overheat. The relationship is not clear in the time-series chart, but we see from the scatterplot that there is a positive correlation between Value returns and interest-rate changes over the test period. In other words, Value has done better when rates were rising, although the relationship is not strong and may fall apart when the increase in yields is much higher than average. The red dots on the chart represent the last six months and, except in November 2020, they seem to follow the historical pattern.
Exhibit 3. Bond Yields vs. Value Performance
Conclusion
This analysis is based on one portfolio and one measure of value in one region, so any broad-based conclusions should be taken with a grain of salt. In addition, as of this writing, Value’s return has been close to zero for the last month. However, to answer the questions “why has value done well” and “will it continue”, from the macroeconomic perspective, it seems that the projected strength in the economy and potentially higher inflation have had their usual impact on Value returns. This may continue to be a positive for Value investors, unless the increases become much larger, and the accompanying overheating economy means the Fed has to tighten. The unusually high exposure to Growth may mean that investors can get both Value and Growth, which should be a positive. However, caution may be in order as Value seems to have started to lose some of its momentum.
[1] As defined by the factor-mimicking portfolio, which is long/short, rebalanced daily, and has unit exposure to Value and no exposure to any other risk factor in the US4 model. The underlying metric for Value is Book/Price.
[2] See What Exactly Is a Factor? Part 2: The Impact of the Long-Only Constraint for more detail.
[3] This long-only portfolio aims to maximize exposure to the US4 model value factor, while maintaining a tracking error of 3%, with no factor, sector, turnover, or other constraints. It is rebalanced monthly, with the Russell 1000 index as the investment universe and the benchmark. We chose this portfolio as our proxy precisely because it does not constrain exposures to other factors.
[4] In this context an exposure of -0.3 can be considered “very” negative.
[5] See “Anxious about rising yields and inflation? Here’s why (perhaps) you should be…”, for example.


