

Last year, Qontigo introduced the EURO STOXX 50® Realized Dispersion Index, which replicates a dispersion trade on its flagship Eurozone blue-chip index.
Dispersion trading consists of taking a position in an index option and the opposite option stance in all the index components. Effectively, by selling the former and buying the latter traders are placing opposite trades on the volatilities of an index and its components and therefore gaining exposure to correlation.
The EURO STOXX 50 Realized Dispersion Index is designed to mirror such a trading strategy, and does so by calculating how much the flagship EURO STOXX 50® Index’s realized volatility deviates from that of its constituents. More precisely, the dispersion index measures the difference between the market-cap weighted sum of EURO STOXX 50 Index constituents’ daily absolute returns minus the index’s daily absolute return. This difference is the representation of daily dispersion.
Absolute returns serve as a measure of daily realized volatility. By calculating a formula based on share prices, the EURO STOXX 50 Realized Dispersion Index can be thought of mimicking a long position in at-the-money straddles1 with one day to maturity on the individual components of the EURO STOXX 50 Index, and a short position in a similar straddle on the EURO STOXX 50 Index.
If the returns of all index constituents exhibit a perfect linear relationship, then they are said to be perfectly correlated and the realized dispersion return is zero. The less correlated the returns, the higher the realized dispersion return.
“The EURO STOXX 50 Realized Dispersion Index seeks to represent a dispersion trade that has long exposure to single-stock volatility of the index constituents and short exposure to the volatility of the index,” said Giulio Castelli, Head of Benchmarks, Strategies and Specialty Themes at Qontigo. “As a result, the index allows market participants to take a view on correlation.”
“There are no option prices involved in its calculation, but instead the index is based on the absolute returns of the index and its constituents,” Castelli added. “Users can rely on a systematic and transparent way to measure dispersion.”
In the options market, demand for market insurance in the form of index puts lifts indices’ implied volatility. On the other hand, portfolio managers’ selling of volatility on single stocks, typically through call overwriting to enhance portfolio performance, depresses single-stock implied volatility. This results in the market overestimating the index volatility relatively to components’ volatility and underestimating the index’s dispersion.2
Demand for dispersion trading
Correlation and its opposite, dispersion, are key fundamental risks equity investors are exposed to. Traders and portfolio managers have long tried to hedge these risks through options-based strategies, while also exploiting them as sources of returns.
According to Antoine Jacquier and Saad Slaoui,3 many banks’ trading desks are short correlation exposure as a result of selling specific structured products to clients, and are therefore interested in offsetting part of this exposure by buying back correlation. In order to do this, they can either buy pure correlation swaps or they can trade dispersion.
Investing in realized dispersion
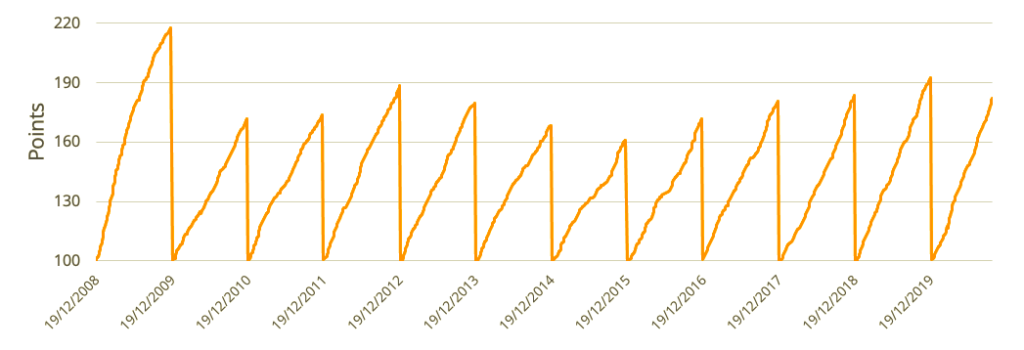
The Dispersion Index resets annually at a reference value of 100 (Figure 1), accruing the daily realized dispersion every December expiration for one year. Realized dispersion becomes investable via forward products such as futures or swaps that have their final payoff linked to the index, allowing traders to bet on higher- or lower-than-expected dispersion or correlation.
Figure 1 – EURO STOXX 50 Realized Dispersion performance
Trading dispersion in 2020
In the low-volatility environment over the past two years, there were stable index moves while single-stock returns dispersed. Trading dispersion in Europe in 2020 has posed additional challenges to market participants, but it has also offered unique opportunities.
According to Optiver, a reliable liquidity provider throughout the COVID-19 pandemic and an expert in listed dispersion trading, the EURO STOXX 50 Realized Dispersion Index has generally reacted positively to high EURO STOXX 50 volatility, illustrated by the index’s performance in 2009 and 2020.
Anand Rathi, lead trader at Optiver, says that it should come as no surprise that the EURO STOXX 50 Realized Dispersion on Sep. 30 touched its highest level for any end of September since 2009.
Due to the way the index is designed — using the difference of absolute moves of the EURO STOXX 50 index and its constituents — it generally outperforms on violent downward moves. This has been particularly true in 2020; following the market downtrend in February and March this year, the Dispersion index reacted positively to strong rebalancing flows and stock-specific news observed after the market stabilized somewhat.
“The effect was most pronounced in the days after the initial pandemic-inspired sell-off, when growth stocks, led by the technology sector, strongly outperformed value stocks such as banks,” said Optiver’s Rathi.
“The EURO STOXX 50 Realized Dispersion Index here showed its quality as a barometer for dispersion, posting in the last week of March 2020 its best-performing week in over ten years,” he added.
1 A straddle involves buying a put and a call on a same security, with the same expiration and strike price.
2 For more on this, see ‘Trading the Dispersion,’ BSIC, Nov. 5, 2017.
3 Jacquier, A. and Slaoui, S., ‘Variance Dispersion and Correlation Swaps,’ Department of Mathematics, Imperial College, London and Zeliade Systems, Paris


