

On Friday November 8, the VIX closed at 12.07, a level not seen since Q4 of 2017. The US economy and stock markets have once again outperformed those of every other developed country this year. And investment-grade corporate-bond spreads — although higher than in Q4 2017 — have all fallen from the highs reached at the end of Q4 2018. That said, geopolitics is creating more uncertainty than ever before. The US president faces articles of impeachment, Brexit is still a no-go, the trade war continues, Hong Kong is having its own version of the Arab Spring, and the global economy is slowing. Is this all just background noise or should investors be wondering if the market’s low volatility reading isn’t just a baited hook here to snag them?
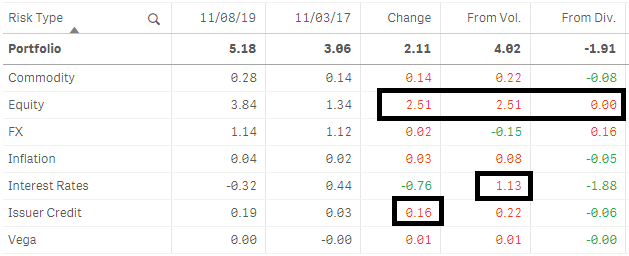
Using the Axioma Risk platform, we analyzed the multi-asset class model portfolio (MAC Portfolio) from our weekly MAC Risk Monitor Newsletter for changes in the key drivers of risk during the 60-days leading up to Friday November 8, 2019 versus Friday November 3, 2017[1]. Figure 1 below shows the portfolio-level summary changes between the two dates. Despite the VIX being only 79 bps (12.07 vs. 11.28) higher, our portfolio risk today is some 211 bps higher than in 2017, representing a staggering 69% increase in risk versus just a 7% increase for the VIX. This increase in risk comes from the combination of a 352 bps (+64%!) increase in the volatility of the assets we own, which is only being partially offset by an increase of 141 bps (+58%) in the cross-asset class diversification between them (i.e. without the huge increase in diversification, portfolio risk would have been much worse). We will need to dig deeper to understand why our portfolio suffered such a large volatility increase in a seemingly low volatility environment. This analysis also highlights the importance of using a multi-asset class risk platform to drive that digging; a single number such as VIX doesn’t tell the whole story.
Figure 1: Portfolio Summary Changes
The table in Figure 2 below shows the decomposition of our portfolio risk at the sub-asset class level on both dates.
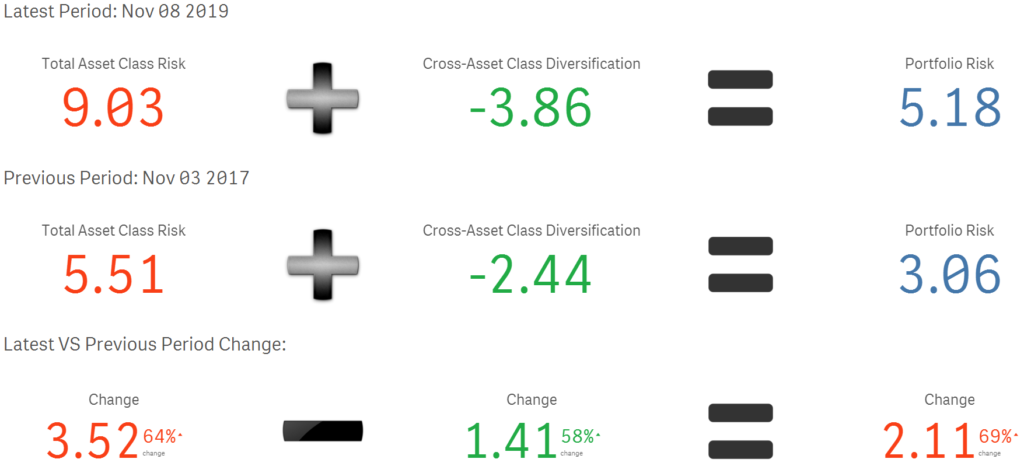
Figure 2: Risk Decomposition at Sub-Asset Class level
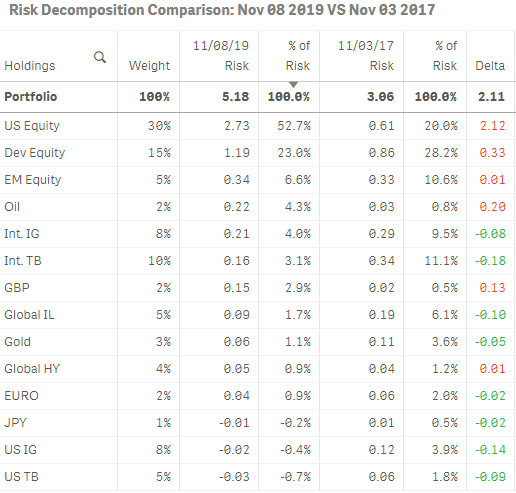
Some observations:
- US equities’ contribution to portfolio risk has tripled, from being 33% less risky than its weight in the portfolio would suggest in 2017 to being 75% more.
- International equities’ contribution has dropped from being more than that of US Equities (28.2% vs. 20%) in 2017—which was some 88% riskier than its own weight in the portfolio would have suggested—to less than half (23% vs. 52.7%) today.
- Emerging Market contribution to portfolio risk went from being half that of US Equities (10.6% vs. 20%) in 2017—and twice its own weight—to just under 1/8th
- International IG bonds are now contributing less than half (42%) of their contribution in 2017.
- The GBP is contributing almost six times what it did in November 2017!
- International Government bonds went from being 11% of portfolio risk to just over 3% today.
- US TB and US IG bonds went from being contributors to diversifiers of risk.
From this table we can guess that equities, not bonds, are the problem today, since the latter has become a diversifying asset class. The opposite directional change in contribution between equities and bonds today versus back in 2017 also suggests a change in the correlation between them. Additionally, sharp changes in the contribution of our currency holdings hints at changes in the correlation between foreign currencies and the USD, which has impacted the risk contribution of our foreign holdings[2]. To understand more about the nature of these changes in contributions to portfolio risk, we ‘go to the matrices’.
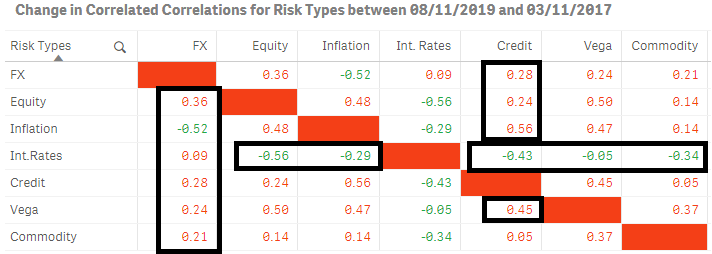
Figure 3 below shows the change in correlations between the sub-asset class holdings in our portfolio since November 3, 2017.
Figure 3: Sub-Asset Class Changes in Correlation
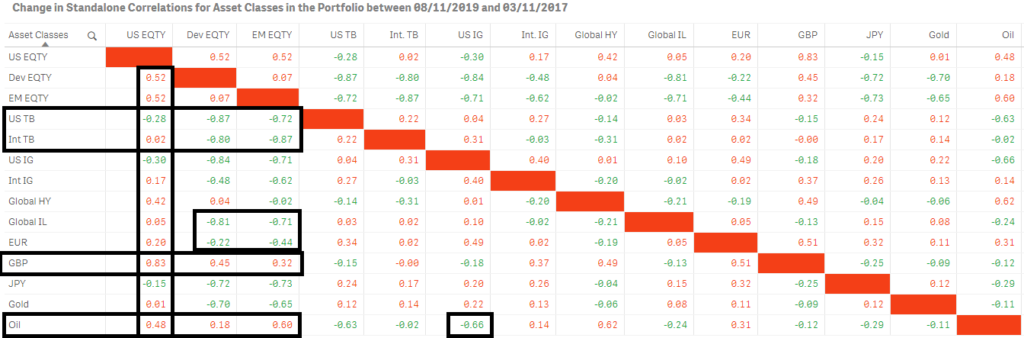
Some observations:
- US Equities saw their correlation rise substantially, with seven of the other 13 sub-asset classes in the portfolio.
- Only US TB (-0.28), US IG Bonds (-30 bps), and the JPY (-15 bps) provided US Equities with a meaningful reduction in risk contribution through more negative correlations.
- Developed (ex-US) Equities saw their correlation with Emerging Equities rise only 7 bps, which was more than offset by increased diversification with other sub-asset classes, except for the GBP (+45 bps).
- The GBP saw its correlation rise substantially with all equity holdings and the euro.
- Non-US Government bonds saw their overall diversification increase through more negative correlation with non-US equities
- Oil’s increased correlation with US Equities was more than offset by the decorrelation with US Treasuries, US IG bonds, Global IL and the JPY .
These changes in correlation, when combined with the changes in volatility for each of the asset sub-class, are what drive the changes in marginal contribution to portfolio risk seen in the table in Figure 4 below. In this table we decompose both the 352 bps rise in volatility, as well as the 141 bps increase in diversification at the asset sub-class level. We do this to understand where increases in volatility were not able to be offset by increases in diversification and where changing relationships should make us rethink our allocation, should we believe that they represent the new state of affairs going forward. We may believe that the changes in the GBP are linked to Brexit and will revert post event. We may also believe that US IG’s decorrelation with US Equities is only due to the recent change in US monetary policy, which would revert if the easing cycle ends. But what of the other changes in relationships and their impact on portfolio risk?
Figure 4: Decomposition of Changes in Contribution to Portfolio Risk
(ranked by change since November 3, 2017 in descending order)
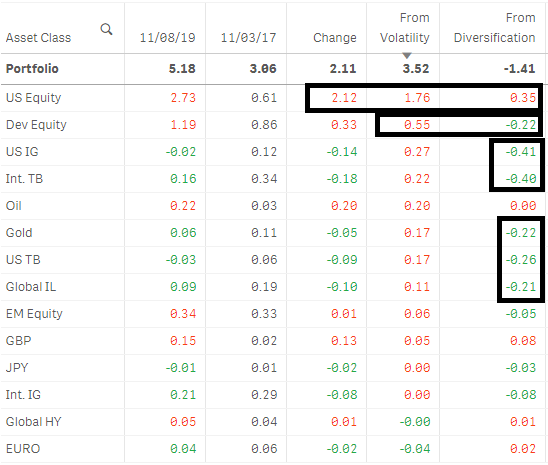
Some observations:
- The 212 bps increase in the US Equites’ contribution is due in part to a 35 bps loss in cross-asset class diversification (the largest loss of all the holdings). This could potentially be much worse if the strong negative correlation with US TB, US IG, and the JPY were to reverse (i.e., under a rising US interest-rate scenario).
- In contrast, Developed (ex-US) equities saw their 55 bps rise in volatility reduced by 22 bps, thanks to increased cross-asset class diversification. This could improve even further if the GBP returns to negatively correlated regime relationship post Brexit.
- Emerging Market Equities and Global HY bonds have acted as anchors in the portfolio through this period, hardly moving in their contribution to either volatility or diversification. They seem immune to the global whirlwinds that have whiplashed other asset classes.
- All bond sub-asset classes have provided good diversification in the face of rising volatility, but International (ex-US) Government bonds have provided the best hedge on a net (volatility minus diversification) basis.
- US IG, International and US TBs, Gold, and Global IL all saw diversification increases that were greater than their volatility increases.
We confirm our assumptions by looking at the same decomposition reports at the risk-type level in Figure 5 below. The sharp increase in diversification between interest-rate and equity risk in the top table drove the bulk of the 191 bps in diversification from the former in the bottom table. This relationship is pivotal for us, since it encompasses 90% of the assets in our portfolio[3].
Figure 5: Decomposition of Changes in Contribution to Portfolio Risk by Risk Type
We also see that the volatility of our overall 46% exposure to foreign currencies (both through direct cash holdings and indirectly through our holdings of foreign securities) declined by 15 bps, but lost 16 bps in cross-asset class diversification from the sharp increase in correlation with Equity, Credit risk, and commodities. Most of the that is probably related to two temporal decisions, Brexit and the US interest-rate policy, which was only partially offset by a more negative correlation with inflation.
Summary and Conclusion
In comparing November 2017 with 2019 we find that the only similarity between the two periods is the VIX level. Equity’s contribution to portfolio risk in November 2019 is almost three times what it was in November 2017 (3.84% vs 1.34%). In late 2017, markets were still in the Trump rally and the USD was rising alongside equities. This meant, in turn, that gains in non-US equities were offset by exchange-rate losses, which explains the relatively low perceived correlation of 0.31 between the US and Dev Equity buckets compared with 0.83 today. Weaker correlation between two categories results in lower risk contributions for both of them. The co-movement of equities and the USD in 2017 meant that all foreign currencies—including GBP—appeared to be inversely related to the US stock market. Nowadays, because of Brexit, the pound is considered more of a “risky” asset, which moves with share prices and resulted in a strong positive correlation with that asset class. The contribution to portfolio risk from International Treasuries appeared so high in 2017 because the exchange-rate movements made it seem like they were (from a US investor’s perspective) more highly correlated with the stock markets in their region than they actually were when just comparing local currency returns. In late 2017, inflation started to slow down and investors began to lower their interest-rate expectations accordingly. This meant that bond prices temporarily rose alongside equities, reducing the previous diversification benefits. That’s why the correlation between US equities and Treasuries was only -0.27 in November 2017, compared with -0.55 now.
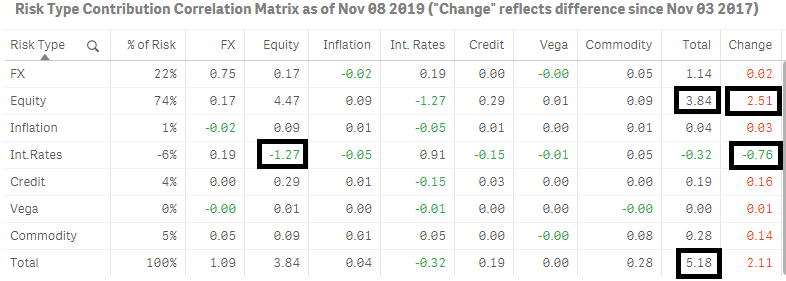
We find that although the VIX today is at a level similar to that of November 2017, suggesting US equities are in a low volatility regime, the contribution correlation matrix in figure 6 shows that the opposite is true with regards to their contribution to a portfolio risk for a USD-based global multi-asset class investor. Not only are US equities the biggest contributor to portfolio risk (3.84%), but their changed correlation with other asset classes have helped raise portfolio risk by 69%. And were it not for the very negative correlation with high grade bonds, portfolio risk would be even higher. Thank you, Mr. Powell.
Figure 6: Contribution Correlation Matrix
[1] On this date, the MAC Model Portfolio reached the lowest risk level (3.06%) since its inception on November 2016.
[2] The portfolio has 50% exposure to equities, 40% to bonds, and holds 46% of its assets in non-USD denominated securities. Changes in these three relationships are key to understanding changes in portfolio risk.
[3] The portfolio has 50% in equities, 40% in bonds, 5% in commodities, and 5% in cash currencies.


