

A slump in Chinese shares is turning out to be one of this year’s most defining market events. The STOXX® China A 900 Index has dropped 19% since Jan. 1.1 That compares to a 3.4% advance for the STOXX® Global 1800 Index.2 The China A 900 Index has plunged 24% from this year’s high on Jan. 24 into a bear market, a term popularly defined by a decline of 20% or more.
Chinese authorities have moved to reduce the economy’s dependence on infrastructure investment, and boost consumption as a key driver of growth. The plan, which aims to control local governments’ borrowing, has been blamed for a slowdown in economic growth. At the same time, investors have sold Chinese shares and the yuan has weakened as a trade confrontation with the US escalated.
Minimum variance working amid volatility
The background of heightened tension has served well for equity strategies designed to limit drawdowns. This is particularly true of minimum variance approaches, which aim to construct portfolios that are far less volatile than their respective markets, and which have this year fended off a large part of the market’s losses.
The STOXX® China A 900 Minimum Variance Unconstrained Index, for example, has declined 10.6% in 2018, or around 8 percentage points less than its benchmark.
STOXX’s Minimum Variance index family provides access to underlying broad indices in such a way that the overall portfolio of the new index has the lowest possible volatility. Additionally, they are constructed around the premise that an efficient minimum-variance approach should take correlation risk into account, avoiding crowding allocations in few sectors that display the lowest price swings.
The minimum variance indices are built using Axioma’s academic-supported fundamental factor model to estimate the correlation of all components within the index. This is a more robust model compared to historical volatility and uses factors including value, growth, different term momentums, leverage, liquidity, exchange-rate sensitivity, country, sector, etc.
The STOXX Minimum Variance Indices come in two versions: constrained and unconstrained. The former indices are limited to the characteristics of their market-cap benchmarks but with lower risk. The unconstrained version, on the other hand, has more freedom to fulfill its minimum variance mandate within the same universe of stocks.
Two-year performance analysis
The outperformance of minimum variance indices grows when extending the comparative analysis back to two years, a period during which concerns about a slowdown in the Chinese economy gathered pace.
Chart 1 shows the performance of the two China A 900 Minimum Variance Indices, and that of an additional derived index: the STOXX® China A 900 Minimum Variance Unconstrained AM (Accessible Market) Index. The latter represents a portfolio of China A shares available to foreign investors through the Northbound Trading segments of the Shanghai-Hong Kong and Shenzhen-Hong Kong Stock Connect programs.
Chart 1
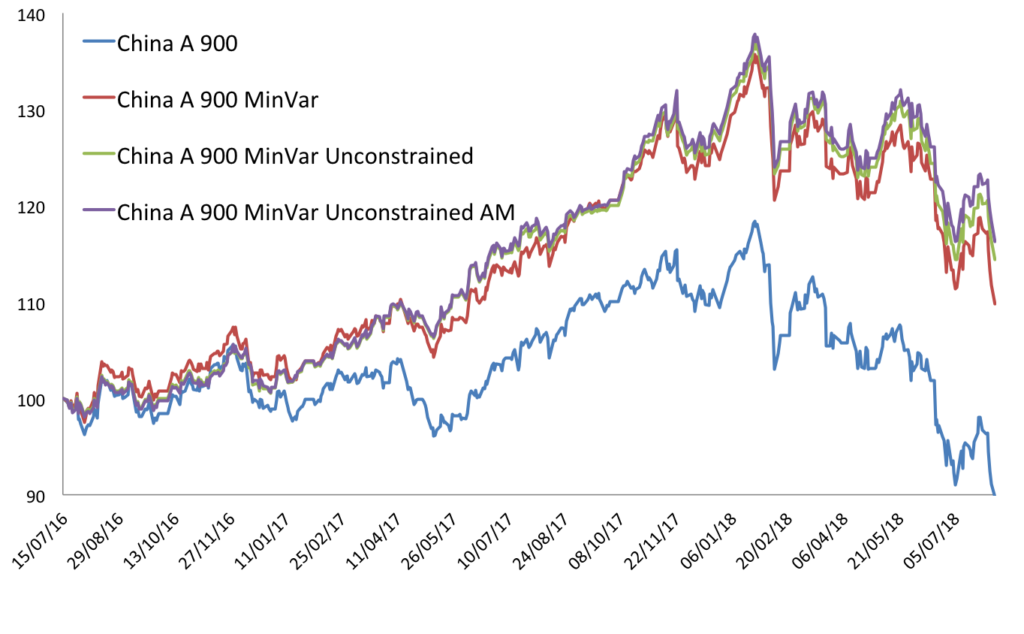
The Market Access Stoxx China A Minimum Variance Index UCITS ETF, which tracks the STOXX China A 900 Minimum Variance Unconstrained AM Index, was listed by China Post Global in June.
Minimum variance strategies tend to outperform significantly when markets are weak – and this downside protection preserves capital, allowing the portfolio to benefit more fully from a market rebound. However, STOXX data show that the minimum variance model also outperforms in most rising markets too.
For more on the construction of the STOXX Minimum Variance Indices, you can read our research paper on the topic.
The outlook for China
Since nearly trebling in value in the year to Jun. 12, 2015, and dropping by more than a third in the ensuing four weeks, wild price swings have been a feature of the STOXX China A 900 Index. The gauge has recorded a higher annualized volatility ratio than both the STOXX Global 1800 Index and the STOXX® Emerging Markets 1500 Index every year since 2012.
Chinese authorities said on Jul. 16 that the economy grew at an annualized 6.7% in the second quarter. The International Monetary Fund has estimated the country’s economy will expand 6.6% in 2018, faster than the 4.9% growth forecast for the entire emerging-markets universe. Between 2000 and 2017, the IMF estimates China grew on average 9.2% each year.
Capturing growth in volatile times
Faster-than-average growth, however, hasn’t protected the Chinese market from volatility in recent years, possibly as investors have already factored in high levels of economic activity. Rather, investors are unnerved by the exacerbation of a slowdown and the scope of economic undershooting.
A minimum variance strategy that gives exposure to growth and offers lower levels of volatility may prove useful in such an environment.


