

The intensifying trade war between the US and China has thus far weighed heavily on the Chinese market, with a more modest impact on the US. Given the differences in the two countries’ sensitivities to non-energy commodities, which are bearing the brunt of the turmoil, the results are not that surprising.
From the perspective of local investors in each market, China’s CSI 300 index posted steep losses (12.7%) year-to-date, while US stocks were up—the Russell 1000 has gained 5.3% thus far in 2018.[1] At the same time, China’s market volatility rose while that of the US fell.
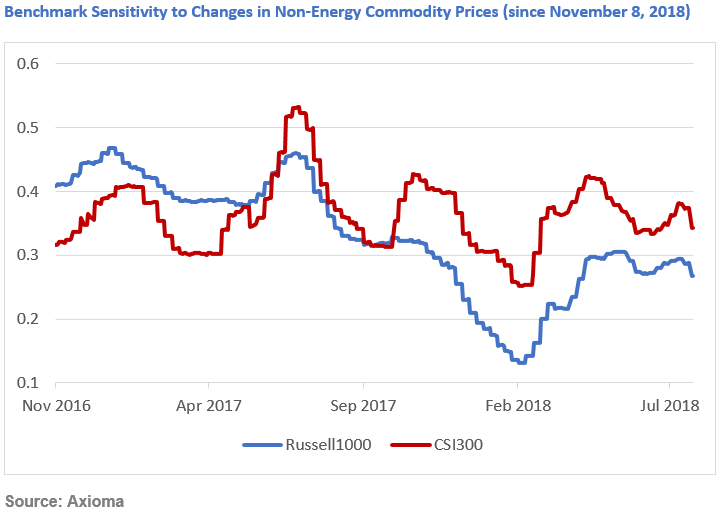
The trade conflict between the largest economies in the world has hurt the non-energy commodity market—as represented by GSCI Non-Energy Spot Price Index—in recent months. The tariff spat caught China more exposed to changes in broad non-energy commodity prices, and the recent downturn in these commodities has weighed heavily on the Chinese market.
While China’s exposure to non-energy commodities has been lower than that of the US historically, the US market showed less sensitivity to the non-energy commodity index in the past 10 months, when arguably it mattered most. Although it remained positive, the sensitivity of the Russell 1000 to non-energy commodities declined abruptly after the US Presidential elections in November 2016—possibly the effect of the more domestically centered policies of the Trump administration.
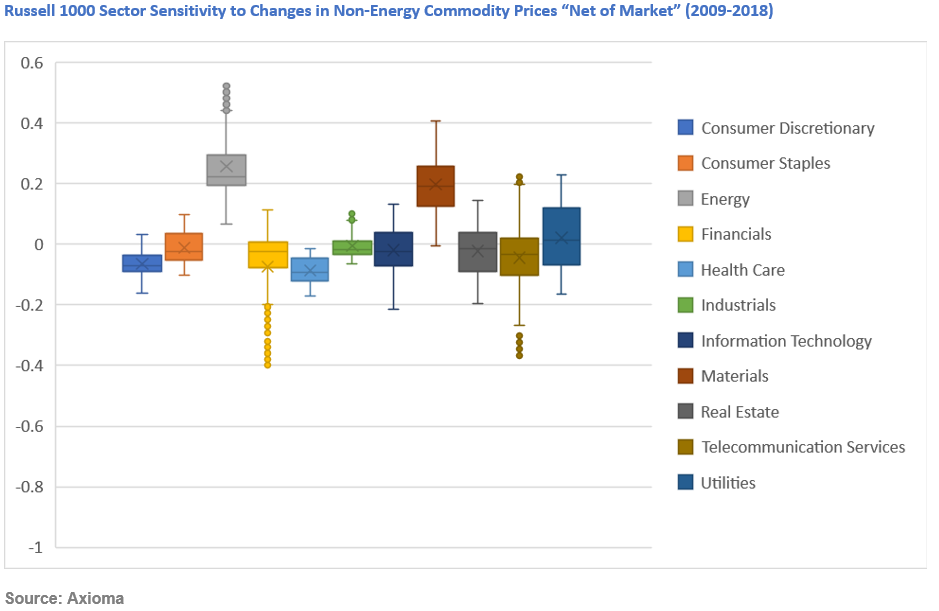
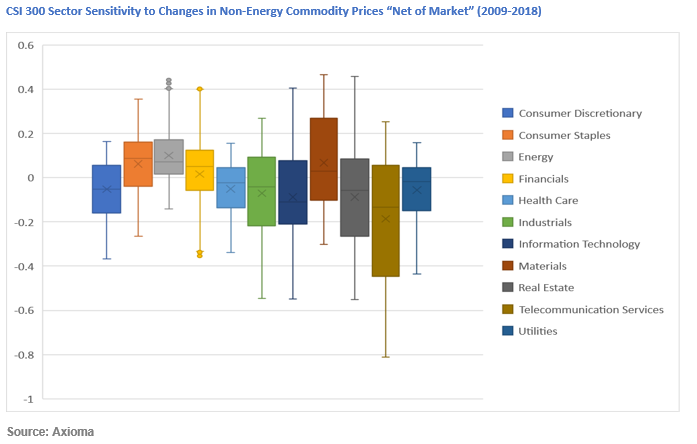
At the sector level, the magnitude of the Chinese sectors’ sensitivities has been much higher than that of US sectors over the past nine years. (Sector sensitivities were calculated “net of market”, in order to carve out the market’s effect on sector performance.)
Most US sectors, including the largest sectors in the Russell 1000—Information Technology, Financials and Health Care—saw negative median sensitivities to commodities for the period between 2009 and 2018. Energy and Materials were the only US sectors with exclusively positive sensitivities during this period, meaning the two sectors moved in the same direction with non-energy commodity prices.
Also, most Chinese sectors saw negative median exposures to non-energy commodities during this period. However, Chinese Financials—the sector with the largest weight in CSI 300–registered a positive historical exposure. Industrials, the second largest Chinese sector, displayed a negative median. Both Energy and Materials saw negative sensitivities during some of the period under analysis, but their historical medians were still positive.
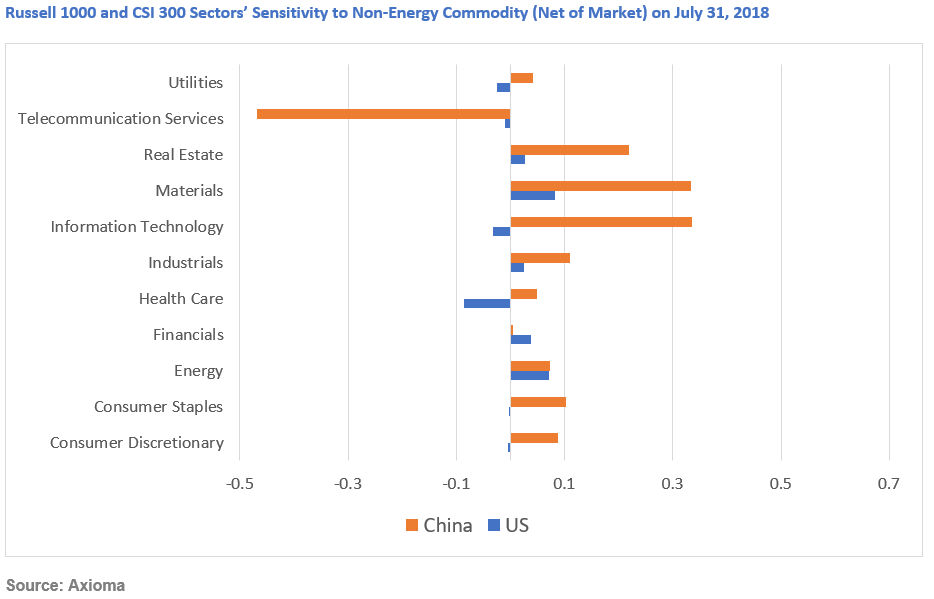
The current sensitivity picture (as of July 31, 2018) is very different for US and Chinese sectors. If commodities continue to fall, all Chinese sectors (except Telecomm—the smallest sector in CSI 300) would be affected negatively in the short term, especially Information Technology and Materials. For US sectors, a decline in commodities would have a much smaller and more varied impact. In the US, the largest negative impact would be on Energy and Materials, while Health Care would benefit, perhaps netting out to little overall effect.
History will tell if the tariff threats were just a negotiation tactic or the start of a new protectionist era. In either case, monitoring commodity exposure may inform investors making sector bets or country bets on the potential effects of changes in commodity prices on their portfolios, as well as help them understand the recent large moves.
For a more detailed analysis of the US vs. China’s sensitivities to non-energy commodities, see our recent white paper “In Trade War, the US Skates while China Suffers—So Far.”
[1] Analysis as of July 31, 2018


