

Willis Towers Watson and Qontigo last year introduced the STOXX Willis Towers Watson Climate Transition Indices (CTI) to meet growing demand for transparent and systematic climate-oriented investment solutions. The indices employ a unique Climate Transition Value at Risk (CTVaR) methodology that quantifies the anticipated impact on equity valuations from the transition to net-zero.
The CTIs enable a more sophisticated way of managing climate transition risk, one that looks beyond carbon emissions and makes a forward-looking, bottom-up evaluation of asset repricing risks in a decarbonization pathway. The CTVaR measure analyses the effect on projected company cashflows of moving from a ‘business-as-usual’ scenario to a world consistent with the goals of the Paris Agreement, using today’s prices.
By using these CTVaR projections, the indices tilt towards companies that are expected to fare well and away from those that are predicted to experience meaningful losses in value as the economy transitions.
The CTI suite consists of four initial indices:
- STOXX® Willis Towers Watson World Climate Transition Index
- STOXX® Willis Towers Watson Europe 600 Climate Transition Index
- STOXX® Willis Towers Watson USA 500 Climate Transition Index
- STOXX® Willis Towers Watson World Climate Transition Monthly Hedged Index
Assessing the implications of adopting a climate-transition risk strategy
A new whitepaper1 from Diana R. Baechle, PhD, Principal, Applied Research at Qontigo, explores the characteristics of the first of those indices, the World CTI, and evaluates its risk profile relative to a traditional global equity allocation as represented by the iSTOXX® World A Index (World Index). To provide a detailed risk analysis of transitioning a traditional portfolio to one that manages climate risks using the CTVaR methodology, the study reviews the changes incurred by shifting from the starting portfolio to the World CTI in successive 25% allocation increments.
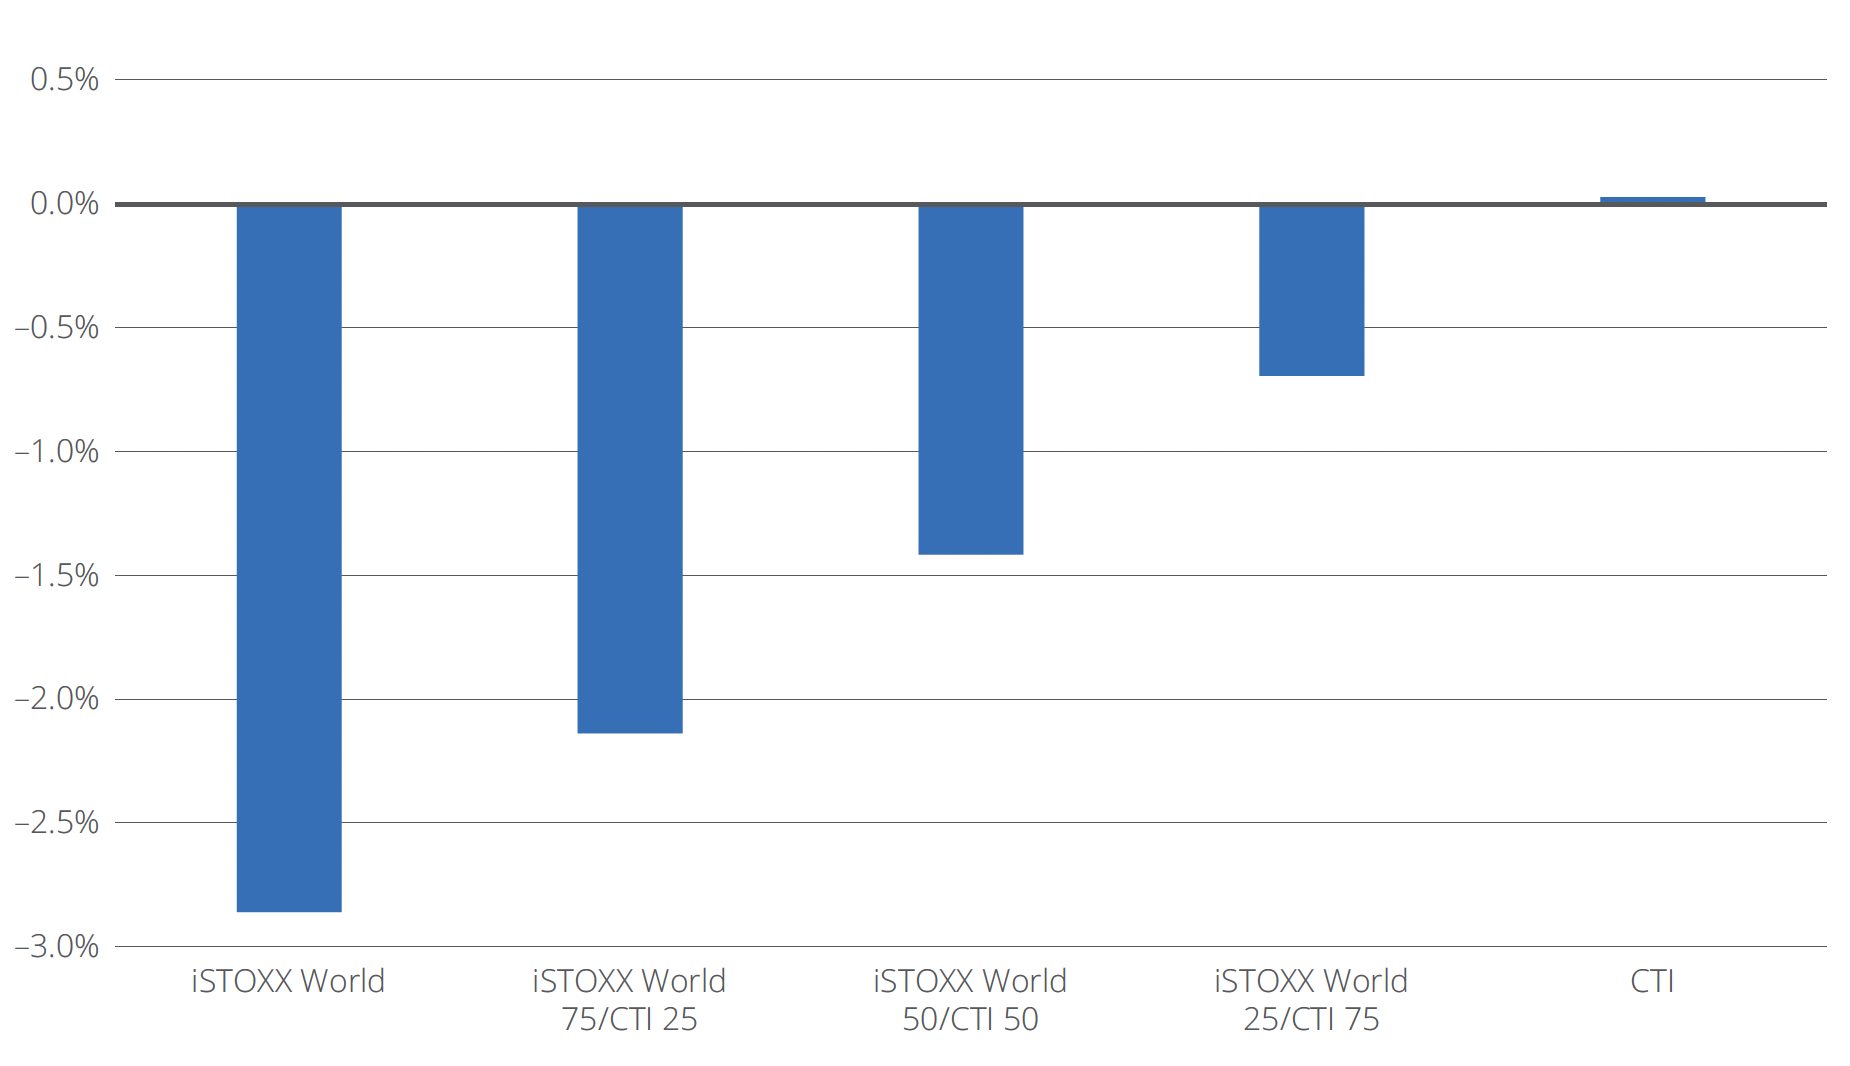
Those incremental allocations to the World CTI take the weighted average CTVaR of the final portfolio to zero, down from –3% for the World Index. In other words, 3% of the starting global index is at risk from the transition to a net-zero economy. (Figure 1).
Figure 1: Climate transition value at risk
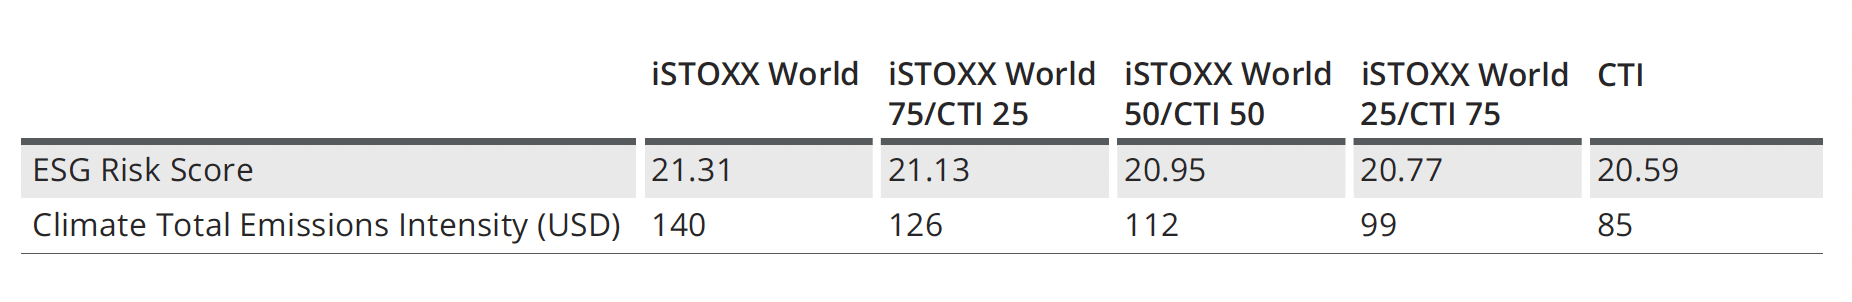
While not an explicit component of the methodology, the World CTI also looks better on other sustainability metrics. The study shows that the weighted average ESG risk score was slightly lower for the World CTI and the progressive portfolios than for the World Index. The World CTI also showed a substantially better profile in terms of carbon emissions (Table 1).
Table 1: Sustainability metrics
Sign up to receive valuable insights, news, and invitations as soon as they are published.
Subscribe >Risk analysis
From there, the study examines the risk attribution, factor risk and style factor exposures of the World CTI and the World Index benchmark to uncover divergences between the two. These are important considerations for investors to understand where biases, and sources of additional risk and returns, may lie.
The World CTI’s total risk was similar to that of the World Index, indicating that incorporating climate transition risk into investment decisions in this way does not result in investors taking on additional volatility, Baechle writes.
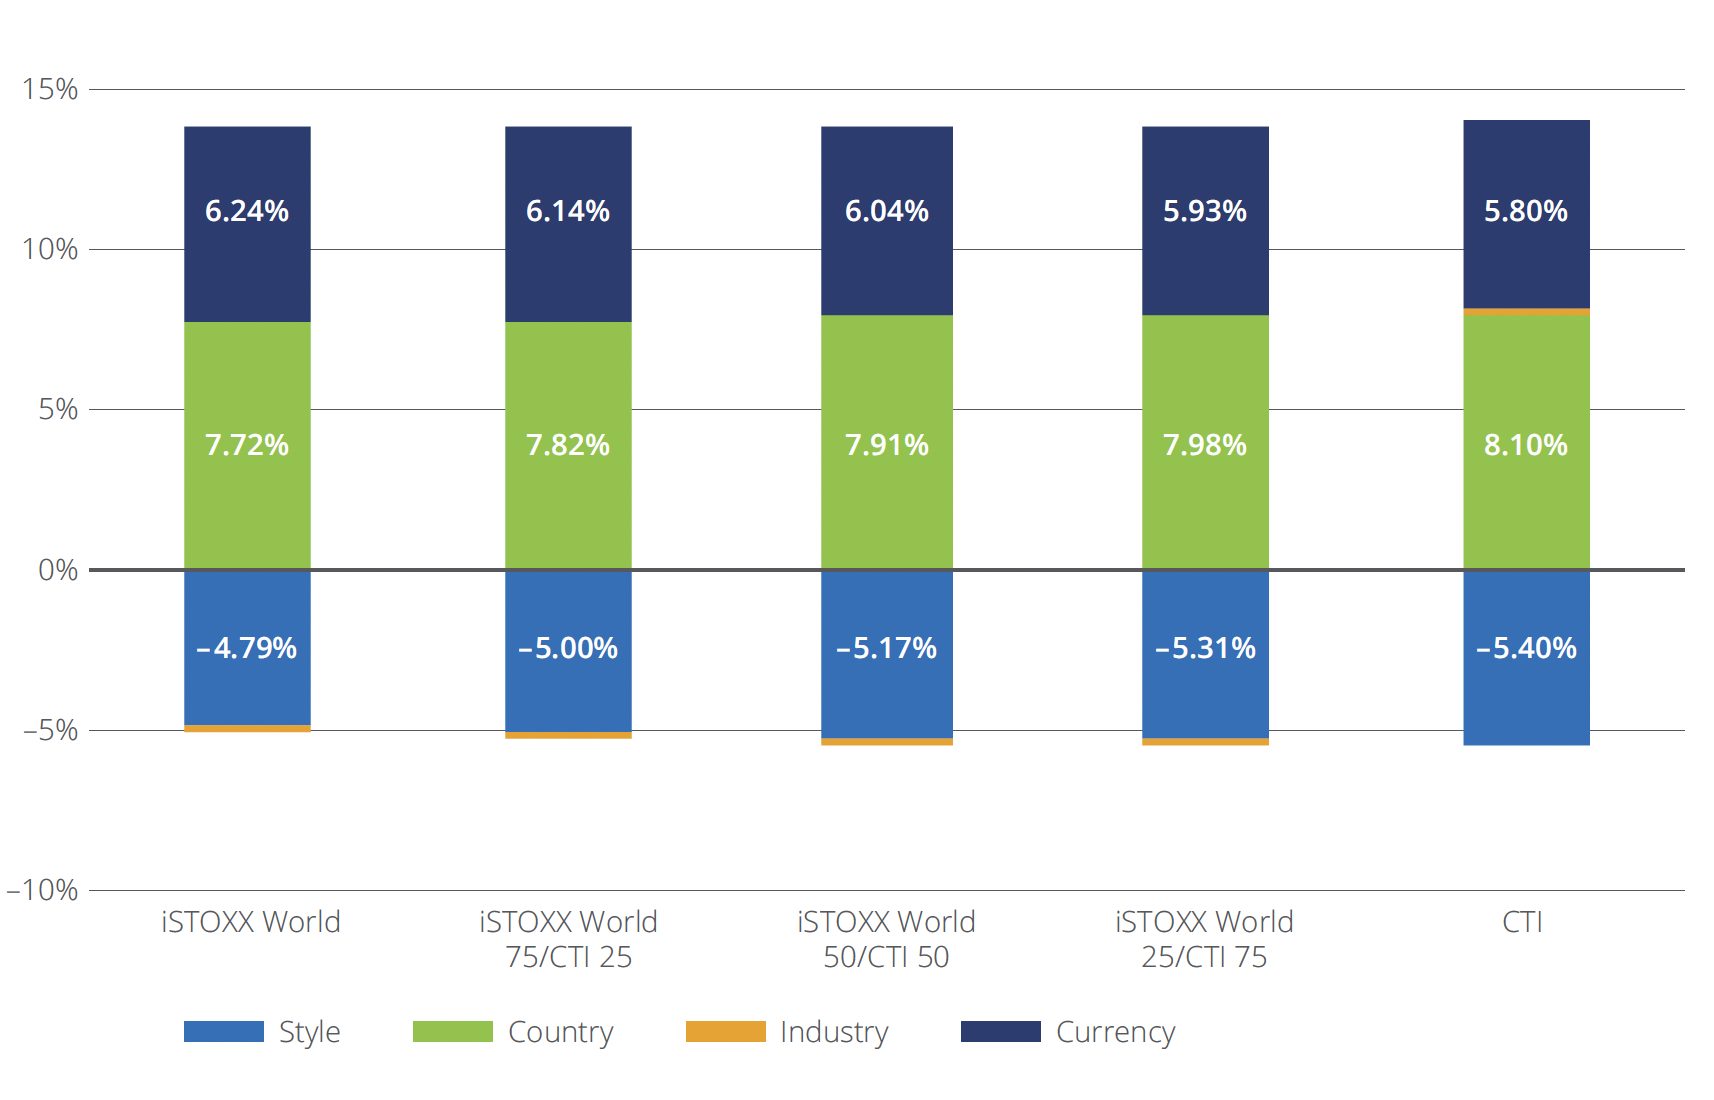
Next, the World CTI had a lower overall factor risk and a higher stock-specific risk (individual attributes of each index component).2 Digging deeper into the first of the two categories, differences arise — albeit minor ones — between the two portfolios. While the headline market risk between the World CTI and the benchmark are similar, the study finds that the World CTI has a lower currency risk, a higher country risk, and a larger negative style factor risk (Figure 2).
Figure 2: Factor risks
Further analysis
Baechle provides further analysis on each one of four sources of factor risk. One of the findings is that the style factor exposures for the World Index and World CTI were directionally similar with only a few, small exceptions. Among those differences, the latter tends to hold larger companies that are more liquid, more profitable and more growth-oriented.
Additionally, the author also shows a comparison of sector and country allocation in the two portfolios. Here, any differences may again be considered immaterial, not surprising given that the CTI methodology is specifically designed to limit deviations from the broad market. Sector divergences include slightly higher weights for the World CTI in Information Technology, Financials, Health Care and Communication Services. At the same time, the World CTI showed lower weights in Industrials, Materials, Utilities and Consumer Discretionary.
The country weight differences between the World Index and the World CTI were muted in general, according to the study.
An alternative for a world in transition
Overall, the CTI shows only small differences to the benchmark in terms of risk characteristics, factor exposures, and sector and country weights. On the other hand, investors benefit from eliminating the financial risk of transitioning to a net-zero economy, while additionally obtaining a lower carbon footprint and a higher ESG score.
These findings show that the CTI strategy is a good replacement or complement to an existing equity allocation that helps align portfolios with a ‘well below’ 2°C scenario. The study’s findings may be of interest to investors considering a new approach to address the risks and opportunities from climate transition, taking a comprehensive perspective of future change in economics and, by consequence, in asset pricing.
We invite you to download the whitepaper and read its findings in detail here.
1 Diana R. Baechle, ‘Holding the world in your portfolio and considering climate transition risks,’ Qontigo, May 2022.
2 The analysis is done using Axioma’s Worldwide Medium-Horizon Fundamental Model (WW4).
Qontigo is a leading global provider of innovative index, analytics and risk solutions that optimize investment impact. As the shift toward sustainable investing accelerates, Qontigo enables its clients—financial-products issuers, asset owners and asset managers—to deliver sophisticated and targeted solutions at scale to meet the increasingly demanding and unique sustainability goals of investors worldwide.
Qontigo’s solutions are enhanced by both our collaborative, customer-centric culture, which allows us to create tailored solutions for our clients, and our open architecture and modern technology that efficiently integrate with our clients’ processes.
Part of the Deutsche Börse Group, Qontigo was created in 2019 through the combination of Axioma, DAX and STOXX. Headquartered in Eschborn, Germany, Qontigo’s global presence includes offices in New York, London, Zug and Hong Kong.


