

The US market hit an all-time high this week. So are we finally out of the volatility woods?
Not by a longshot.
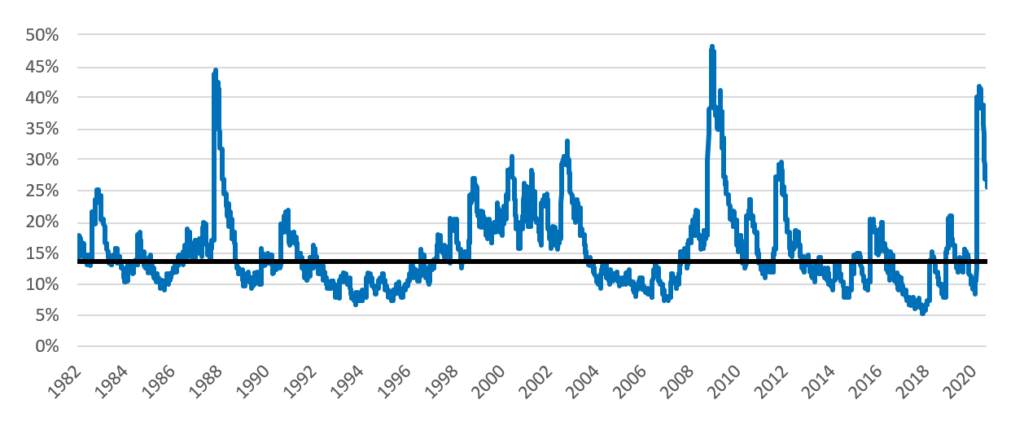
While US predicted risk as measured by Qontigo’s short-horizon fundamental model has retreated substantially, it remains in the top decile of values relative to where it has been historically. It would have to drop by almost 50% from its current level just to get back to the long-term median (Figure 1).
Of course, history suggests the trend is more likely to continue downward, despite rising uncertainty. As noted in this week’s highlights, current worrisome issues include an increase in coronavirus cases that may delay the full re-opening of the US economy, stalled negotiations over a new US government stimulus package, intensified tensions between the US and China, and the looming November election. This market has unquestionably climbed the proverbial wall of worry, as its volatility has slowly ticked down.
Figure 1. Short-Horizon Fundamental Risk Forecast, Axioma US Top 1000 Market Portfolio[1]
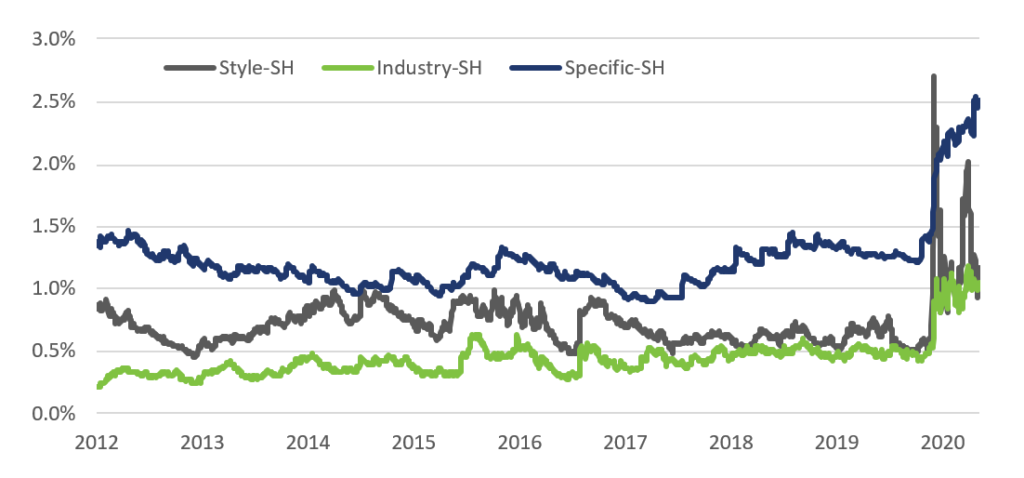
And while total risk has fallen, not all the building blocks have followed suit. Aggregate industry, style and specific risk in the STOXX USA 900 all jumped sharply when the market peaked in February (Figure 2). And all have since doubled. While Style risk retreated somewhat this quarter, Industry and Specific risk continued to climb, and are now about 10% higher than they were at the end of June. All remain very near the high ends of their levels since 2012.
Figure 2. Components of Short-Horizon Predicted Risk, STOXX USA 900
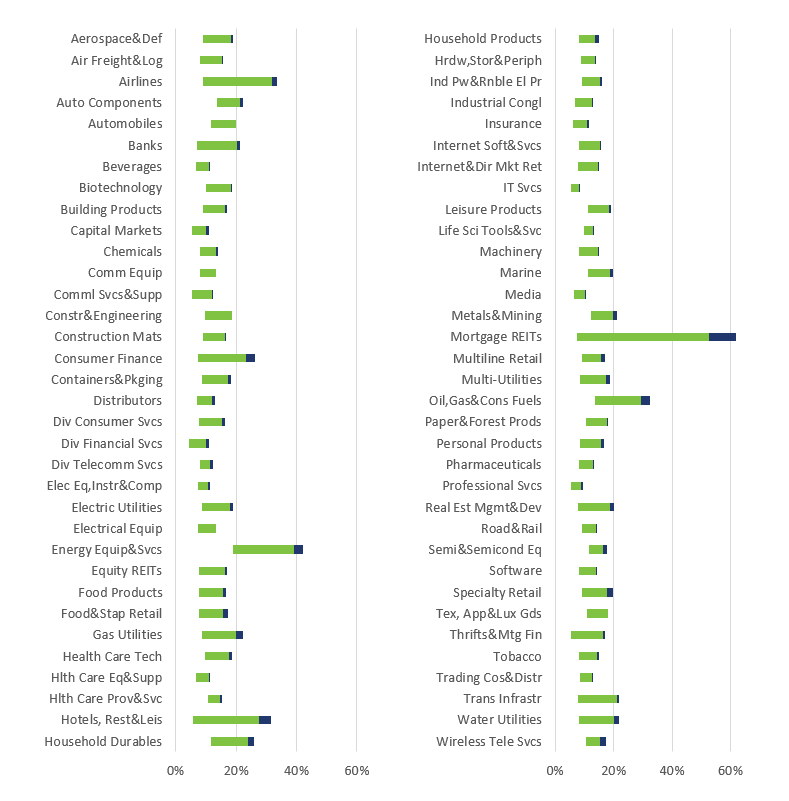
Digging one level deeper, we also note that the current level of volatility for most individual factors in the US model is also much closer to all-time highs than they have been for quite some time (Figure 3). As we have written about extensively, individual factor volatility exploded across the board, starting at the end of February. Volatility for almost every industry and style factor remains within the top quintile or decile relative to long-term history. Figure 3 shows the range of medium-horizon predicted volatility for US industries and style factors over the last year, with the current level at the break between the colors on the bars in the chart below. Many are almost at 12-month highs, while a few have backed off a bit more. None has current risk anywhere near the low end of the range.
Figure 3. 12-Month Volatility Range, US4 Medium-Horizon Model, Industries and Style Factors
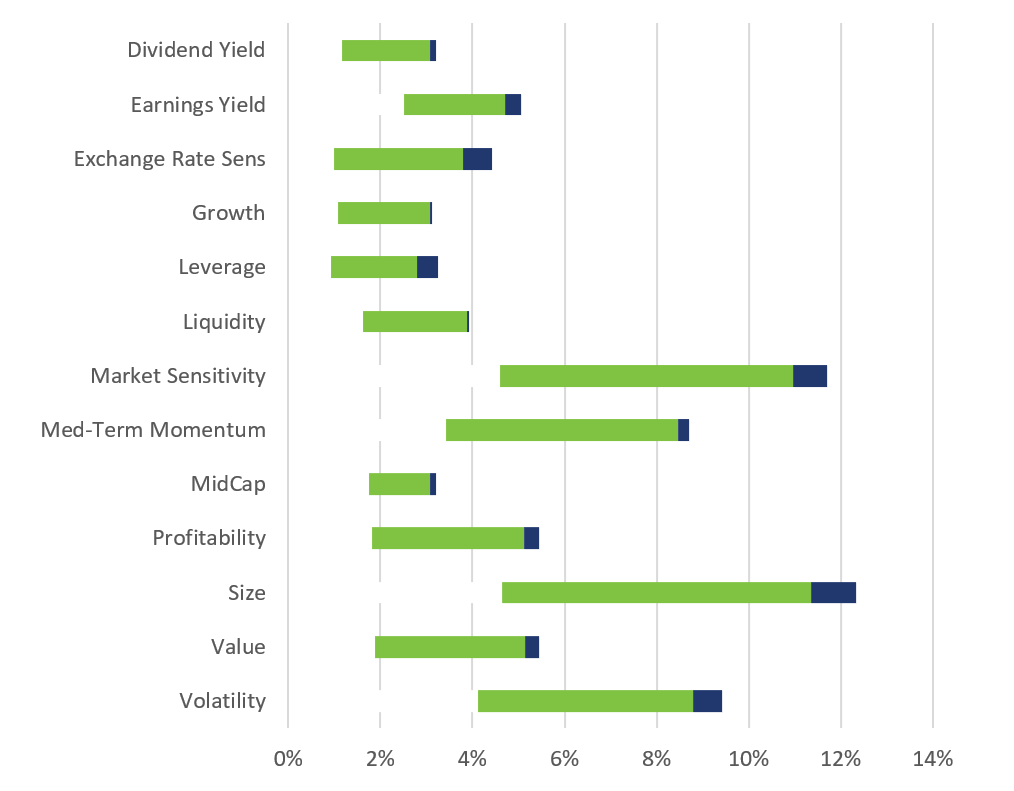
Ah, but here’s the good news. Factor returns in our broad-based US4 medium-horizon fundamental model seem to have settled down, and in most cases remain within two standard deviations of their long-term average values for the quarter-to-date period. At least this is the case if we use volatility at the beginning of the third quarter in the denominator[2], which, of course, was very high level relative to history, and if we also use the long-term average level of volatility. In the broad US universe, only Dividend Yield[3] and Earnings Yield returns fall outside the range. Growth’s positive return is close to being much higher than average, but no other factors’ returns fall outside the two standard deviation range.
The same is not true, however, when we limit the universe to small-cap stocks and use our small-cap model. Here, Dividend Yield, Earnings Yield, Exchange Rate Sensitivity and Growth all have outsized returns, and Leverage is close. However, these “run-of-the-mill” returns suggest that factor volatility may soon begin to recede.
Figure 4. Factor Returns, US4 and USSC4 Medium Horizon Models, Third Quarter to Date*
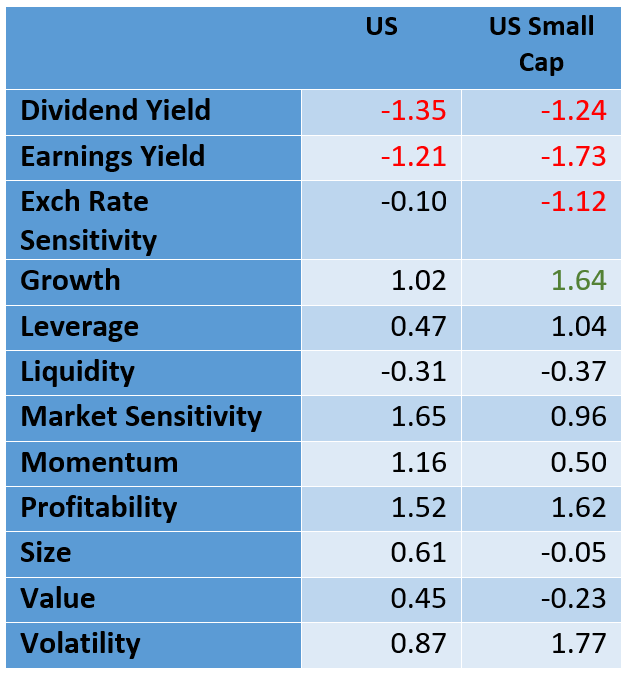
*Through August 19. Returns highlighted in red are below average, while the one in green is above average.
Many investors may see the recent strength in US equities as a primrose path. But for active managers concerned about their active returns, that path seems fraught with hazards. Of course, higher risk can mean higher return, at least in the active sense (see my colleague Olivier d’Assier’s recent post about the benefits of lower risk levels here). But rising volatility in those factors managers hope to help them beat the market must be watched closely.
[1] We use the Axioma Market Portfolio here because it has history back to 1982. Tracking error between this portfolio and the STOXX USA 900 index, used elsewhere in this post, have tracked each other closely since the latter’s inception.
[2] We calculate a “normalized” return as the (actual factor return – its long-term average)/risk. We typically use the risk at the beginning of the return period for this calculation.
[3] On average, the Dividend Yield return is slightly negative, whereas Earnings Yield’s return is positive.


