

They are among the strongest engines of the world’s economy, but in equity markets, developing nations have trailed rather than led this decade.
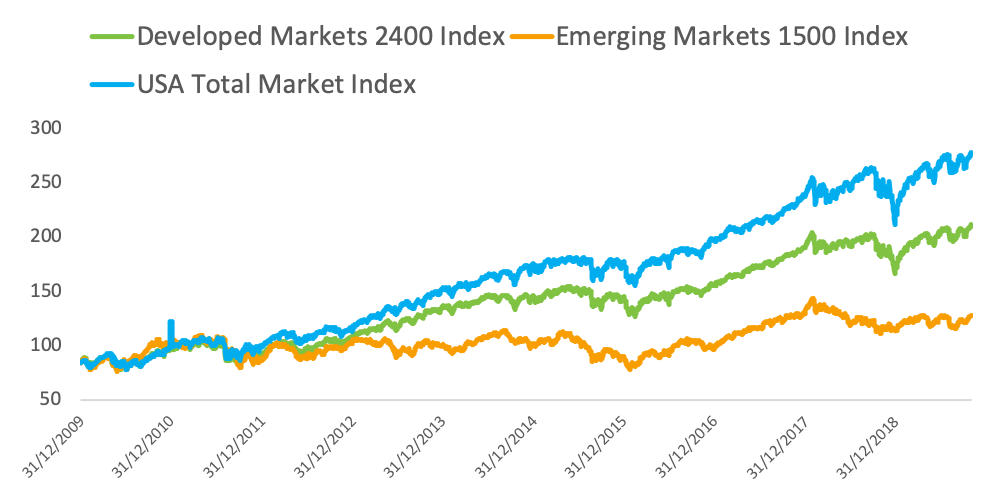
Since the start of 2010, the STOXX® Emerging Markets 1500 Index has gained 51%, or about 4.2% per year, when measured in dollars and inclusive of dividends.1 That compares to a 146% total return for the STOXX® Developed Markets 2400 Index, which translates into an annualized 9.4% advance. In other words, developed markets have returned almost three times as much as their emerging counterparts during the past decade.
To put the recent performance into context, the emerging-markets index climbed at an annual average of 32% between 2003 and 2009, a period that includes the global financial crisis.
The effect of the dollar
So, what has caused the recent slow traction, particularly surprising in a world of low interest rates and ongoing industrialization and urbanization of less-developed countries?
One caveat before delving into the reasons for the underperformance is to consider the dollar’s upside move against emerging-nations currencies since 2010. The Brazilian real, Russian ruble, South African rand and Turkish lira, for example, have lost more than 50% of their value to the greenback, hurting the dollar-based performance of the STOXX Emerging Markets 1500 Index.
The pull of the US bull
While currency fluctuations have weighed on the translation effect of stock returns, they only explain part of the lag in emerging-market indices.
A second disclaimer is that developed-markets benchmarks have been propelled by the exceptional performance of US stocks. Chart 1 shows the STOXX Emerging Markets 1500 Index and the STOXX Developed Markets 2400 Index, together with the STOXX® USA Total Market Index.
The US index has since 2009 posted one of the longest rallies on record, pulling higher the Developed Markets Index, whose weight is more than 60% derived from US companies.
Chart 1
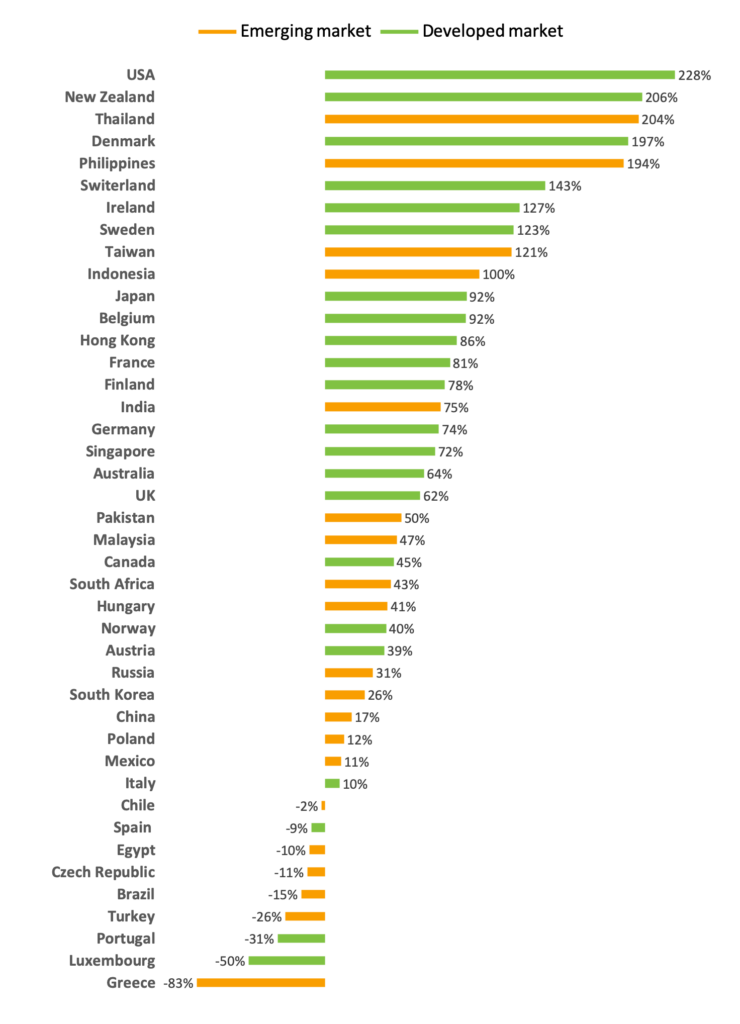
A look at the national level, however, shows that the emerging-vs.-developed divide was broad rather than concentrated in any given country. Table 1 shows the performance since Jan. 1, 2010 of STOXX Country Total Market Indices (TMI) for 19 emerging countries (in orange) and 23 developed nations (in green) tracked by STOXX. Most ‘orange’ markets occupy the lower and mid strata — with exceptions from Southeast Asian markets — while ‘greens’ populate the top slots, with Southern European markets bucking the trend.
Table 1
Risk aversion, deceleration, trade woes
Perhaps more prevalent in investors’ minds has been the deceleration in some emerging economies. China grew 6% in the third quarter of this year, its weakest rate in 27 years. While that is an accomplishment that western economies would envy, investors have priced in the slowdown from the double-digit Chinese growth rates of the 1990s and 2000s.
This slowdown is partly due to a political strategy. China has invested to shift away from its dependency on exports towards boosting its domestic market. While this has weighed on growth rates in the short term, the goal is to create a less volatile future growth path.
Global politics haven’t helped either. The STOXX® China Total Market Index has fallen 6.3% since January 2018 as US President Donald Trump led a trade offensive to restrain Chinese imports.
Emerging markets have also suffered from post-financial-crisis trauma. While global equities have rallied since 2009 on the back of exceptionally loose monetary policy, investors have favored those sectors, styles and asset classes deemed more conservative — growth, low volatility, developed markets — and shied away from riskier ones, including emerging markets.
Banks, energy ruled emerging markets
Sector allocation has also weighed against emerging markets. The two biggest supersectors in the emerging-markets index in 2012 were banks and energy. Since then, the latter has trailed all other 18 supersectors. Banks were the fourth-worst group during the period.
By comparison, the developed-market index has comprised a larger share of supersectors that have fared much better in the past seven years, among them technology and healthcare stocks.
Today, the technology and consumer-services supersectors have gained a stronger foothold in the STOXX Emerging Markets 1500 Index, as a result of investment and economic development in the region in recent years. Banks remain the largest industry, but energy has fallen outside of the ten largest supersectors.
A changing outlook
Looking forward, things could be different for emerging markets. Cheaper valuations relative to developed markets, a global slowdown, lower interest rates, stronger domestic dynamics and a lead in innovation are all drivers that stand to benefit the asset class, according to investors including Raheel Altaf at Artemis.2
That said, the asset class has historically been susceptible to global risk aversion and the direction of interest rates and money flows. Investors will be hoping these will be supportive so emerging markets can recoup their lost ground.
Featured indices
1 Total returns before taxes through Oct. 31, 2019.
2 Raheel Altaf, Artemis, ‘Have fears for emerging markets been overstated?’ Sep. 26, 2019.


