

- US Risk-On Rally led by Market Sensitivity, Volatility Factors
- Emerging/Developed Diversification Ratio Continues to Grow
US Risk-On Rally led by Market Sensitivity, Volatility Factors
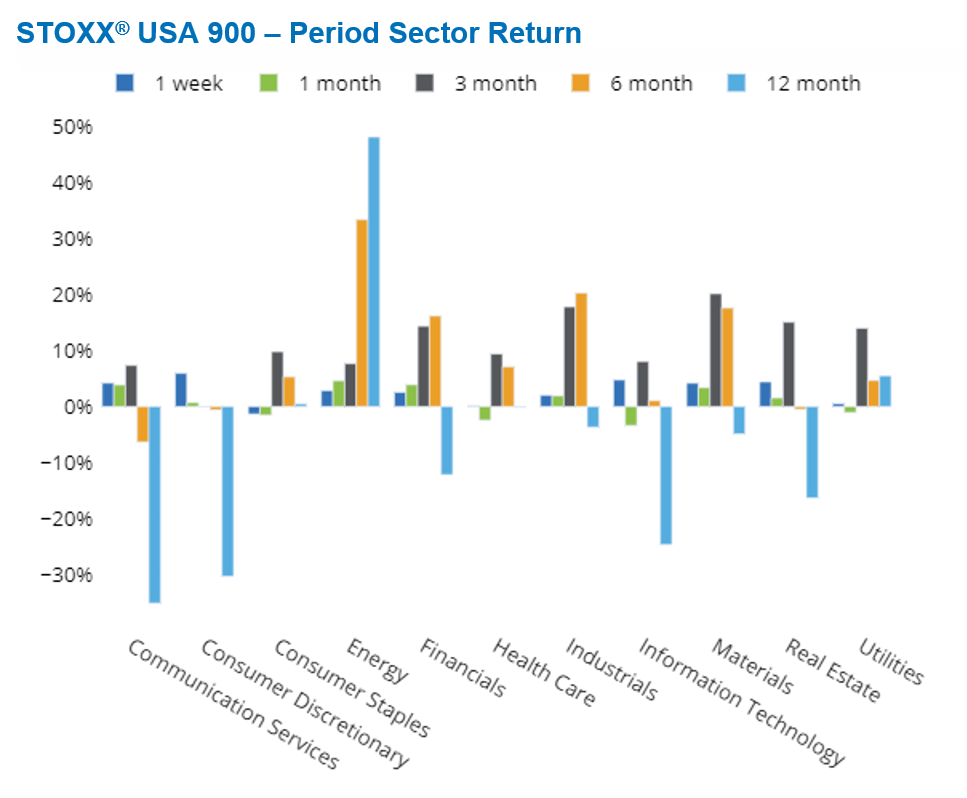
Most global markets were up in the 2nd week of 2023, continuing a strong start to the year. Positive sentiment was attributed mainly to a slowing pace of inflation in the US and a non-farm payroll number that was still well over 200k. In the United States, cyclical sectors had the best performance. Consumer Discretionary was up almost 10%, Information Technology rose 6.6%, Real Estate gained 5.5%, while Consumer Staples was down 1.3% and Health Care was flat last week:
See graph from the United States Equity Risk Monitor as of 13 January 2023:
In conjunction with this rally of the more beaten down sectors of 2022, we saw a strong reversal in the Market Sensitivity factor along with Volatility (which had begun a bit earlier):
See graph from the United States Equity Risk Monitor as of 13 January 2023:
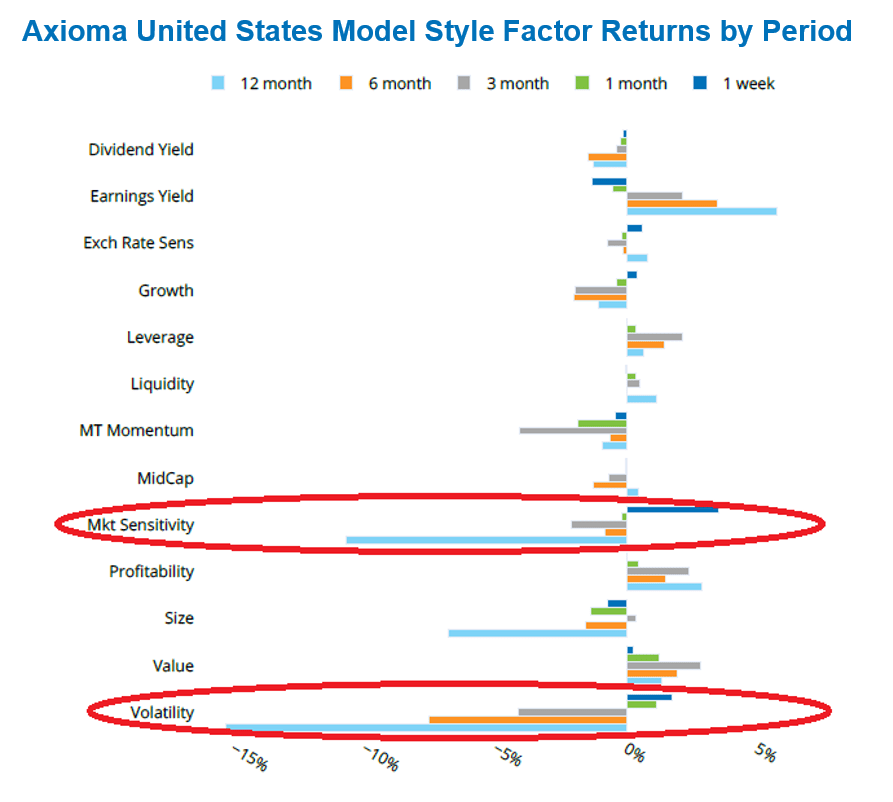
This what typically occurs as markets come out of a drawdown period, although of course there is no guarantee that the rally is sustainable. For example, there was a similar reversal of these two factors in the summer of 2022 that is no longer visible in the 12 month or 6 month returns.
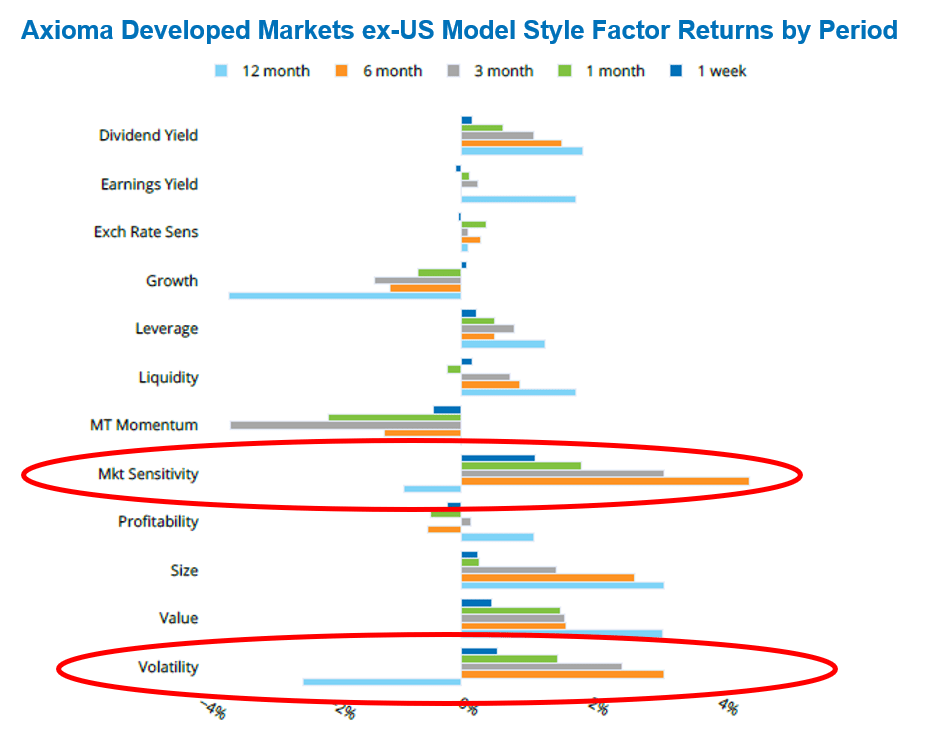
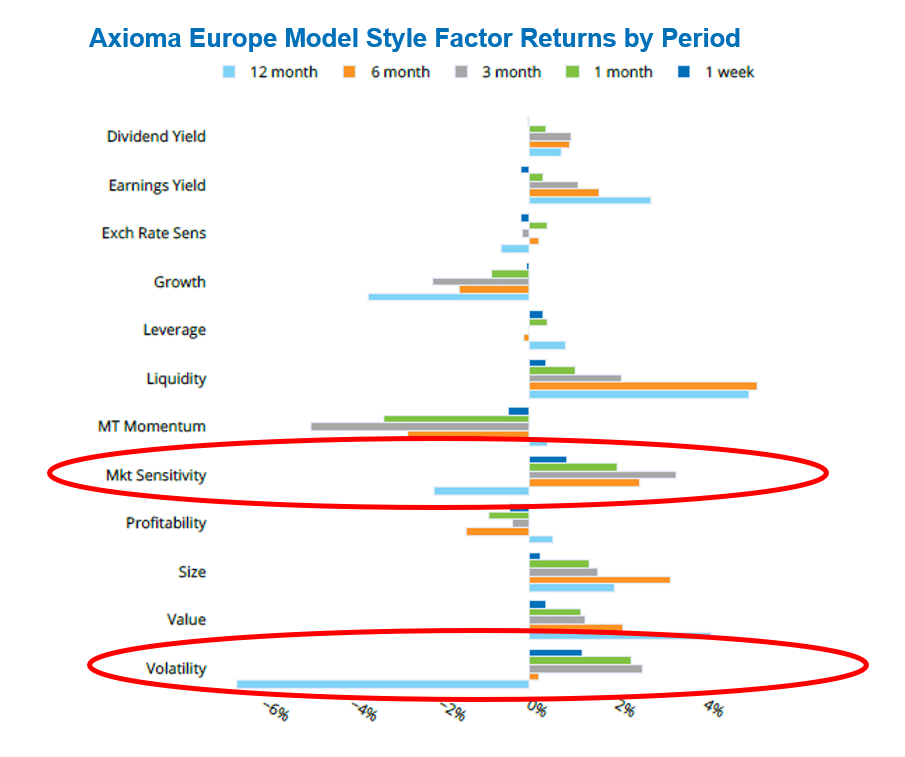
In Developed Markets ex-US, and even in Europe, the Market Sensitivity and Volatility returns have been trending positive for a much longer period:
See graph from the Developed Markets ex-US Equity Risk Monitor as of 13 January 2023:
See graph from the Europe Equity Risk Monitor as of 13 January 2023:
Emerging/Developed Diversification Ratio Continues to Grow
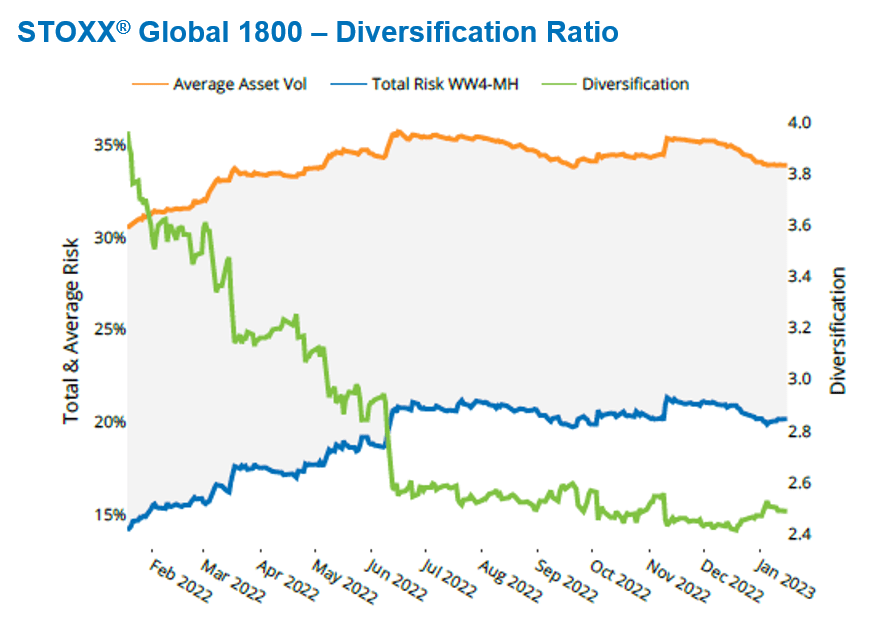
We last highlighted this in the beginning of December, but it’s worth re-examining in the new year. These charts display the difference between the weighted average stock-level volatility in each index vs. the index-level risk forecast, which benefits from return correlations of less than one amongst index constituents. The higher the diversification ratio, the greater the difference between the weighted sum of the stock level volatilities (which is like assuming all correlations are 1) and the index-level risk forecast, which takes into account the estimated correlations:
See graph from the Global Developed Markets Equity Risk Monitor as of 13 January 2023:
See graph from the Emerging Markets Equity Risk Monitor as of 13 January 2023:
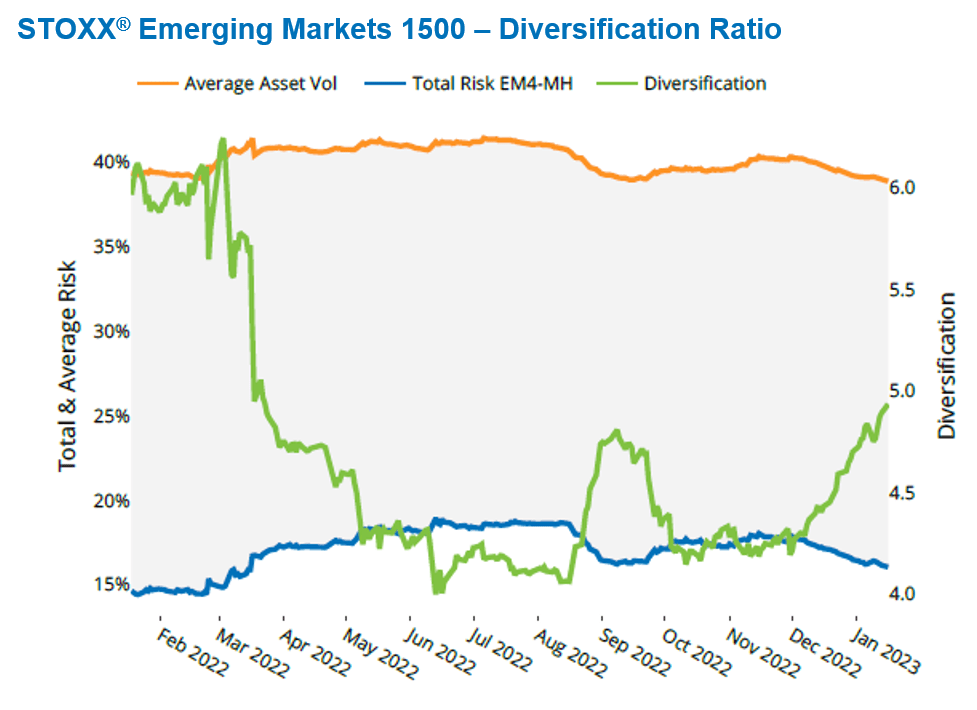
On the 9th of December, the Emerging Markets 1500 diversification ratio was 1.79x higher than the Global 1800’s. As of the 13th of January, it is 1.96x higher. Even as risk has at least temporarily peaked in Developed markets, Emerging markets risk is still markedly lower, and the diversification, or lack thereof in Developed markets, appears to be the main reason why this is so. More to come on this subject in an upcoming research paper.
For more insights and research from the Applied Research team, please click here.


