FEATURED INDICES
Current performance from featured STOXX and DAX indices


WHAT SETS US APART

in index innovation
Highly Customized Solutions
Collaboration, adaptability and customization are in our DNA.
Find out more >
Leading European blue-chip indices
Global Strength
We are European-based with offices across the globe.
Find out more >
Structured Products & Derivatives
Globally leading provider of equity index solutions
Expertise and Innovation
Transparent, rules-based indices, delivering innovative solutions.
Find out more >
NEWS & RESEARCH
European benchmarks – the STOXX ecosystem
STOXX’s European benchmarks offer transparent and liquid exposure to the region, and are at the center of a wide ecosystem of derived investment strategies and products. Those characteristics have made the indices the top choice for issuers of investable products.

Europe’s ‘GRANOLAS’ overtake US ‘Magnificent Seven’ in performance
They have strong profitability, low volatility and have been quietly leading gains in the European equity market. The GRANOLAS – a group of 11 large, international companies – may have the right attributes for the current macro environment, argues Goldman Sachs.
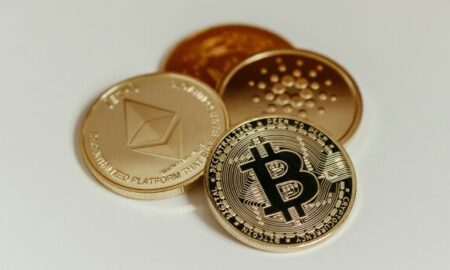
Valour launches ETP on first STOXX crypto blue-chip index
The investment product has been listed on the Frankfurt Stock Exchange. The underlying index follows a best-in-sector selection methodology and has a unique blue-chip focus that selects assets based on specific crypto-market criteria for quality.