

- High volatility stocks fall out of favor
- Are new sources of risk creeping into the US market?
- Asset diversification soars globally
High volatility stocks fall out of favor
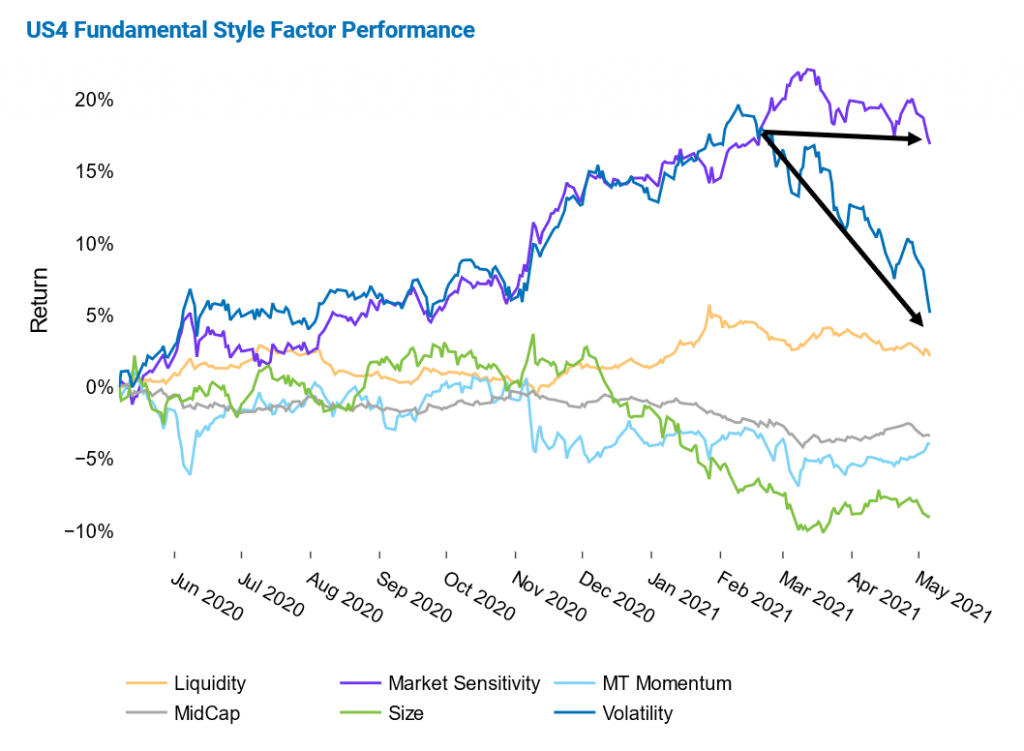
The return of the Volatility factor has nosedived over the last three months, while Market Sensitivity—which moved in tandem with Volatility in the prior nine months—has been relatively flat since February. During the first nine of the last 12 months, Volatility and Market Sensitivity soared together, indicating that investors preferred both high volatility and high beta stocks. The two style factors’ nine-month returns at the beginning of February were spectacular, at nearly 20%, making them by far the best performing style factors in the Axioma US medium-horizon fundamental model.
Since February, however, Market Sensitivity has stagnated, while Volatility has plunged. That is, high volatility stocks fell out of favor, while high beta stocks were no longer gaining ground. As of last Thursday, Volatility’s three-month return was around -10% —more than two standard deviations below its long-term average, based on the risk forecast at the beginning of the period—while that of Market Sensitivity neared zero. Both style factors still posted positive 12-month returns last week, with Market Sensitivity exceeding 15% and Volatility just above 5%. This pattern could be observed to a lesser degree in most other regions Axioma models track closely.
See graph from the US Equity Risk Monitor as of 6 May 2021:
Are new sources of risk creeping into the US market?
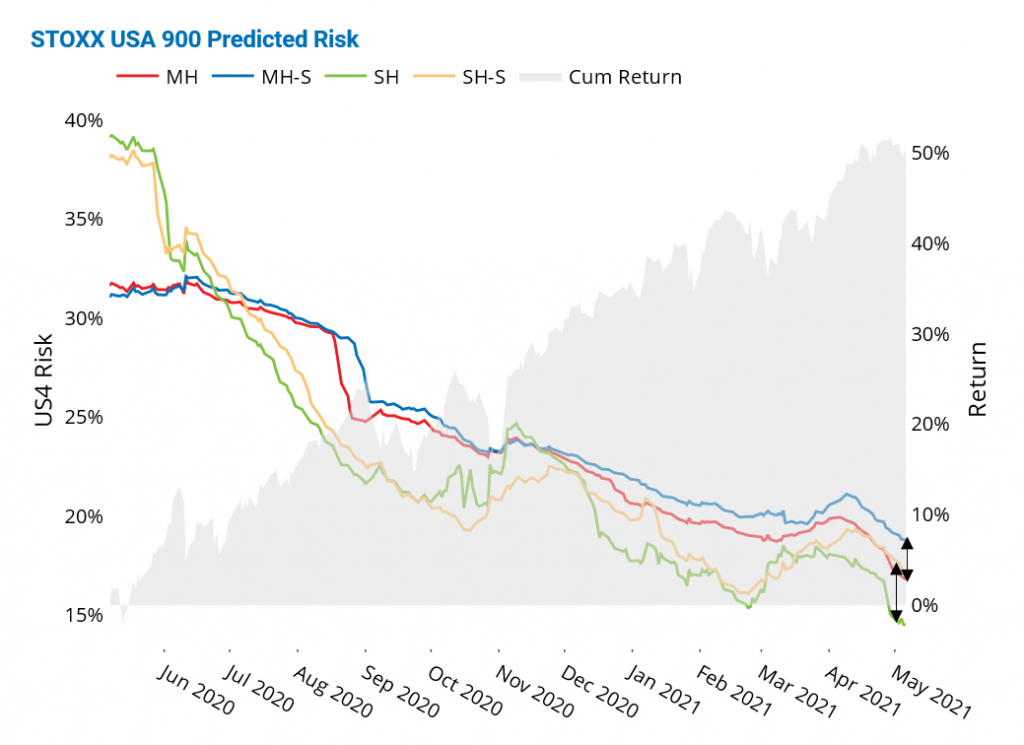
While risk has dropped abruptly in the US, statistical-fundamental risk spreads have widened, suggesting that extra risk is being picked up by the statistical models. This may point to potential changes in the risk regime and/or the emergence of non-traditional factor risk sources in the US. Predicted risk for the STOXX USA 900 index has continued to decline, with each of the four variants of Axioma’s US4 model—fundamental and statistical at the medium- and short-horizons—dipping to 12-month lows last week. The spreads between the statistical and fundamental forecasts have become more positive since March of this year, and are now around 3% at the short horizon and about 2% at the medium horizon. The US is the only region to have experienced this rise in spreads.
Interestingly, at the height of the Covid crisis in March of last year, the statistical-fundamental spreads were lower than they are currently, suggesting that unlike previous market downturns where the statistical variants predicted much higher risk than their fundamental counterparts, the Covid-19 crash seemed to be much more fundamental in nature. At that time, the fundamental variant was predicting higher risk than the statistical one at the medium horizon, while only slightly lower at the short horizon.
See graph from the US Equity Risk Monitor as of 6 May 2021:
Asset diversification soars globally
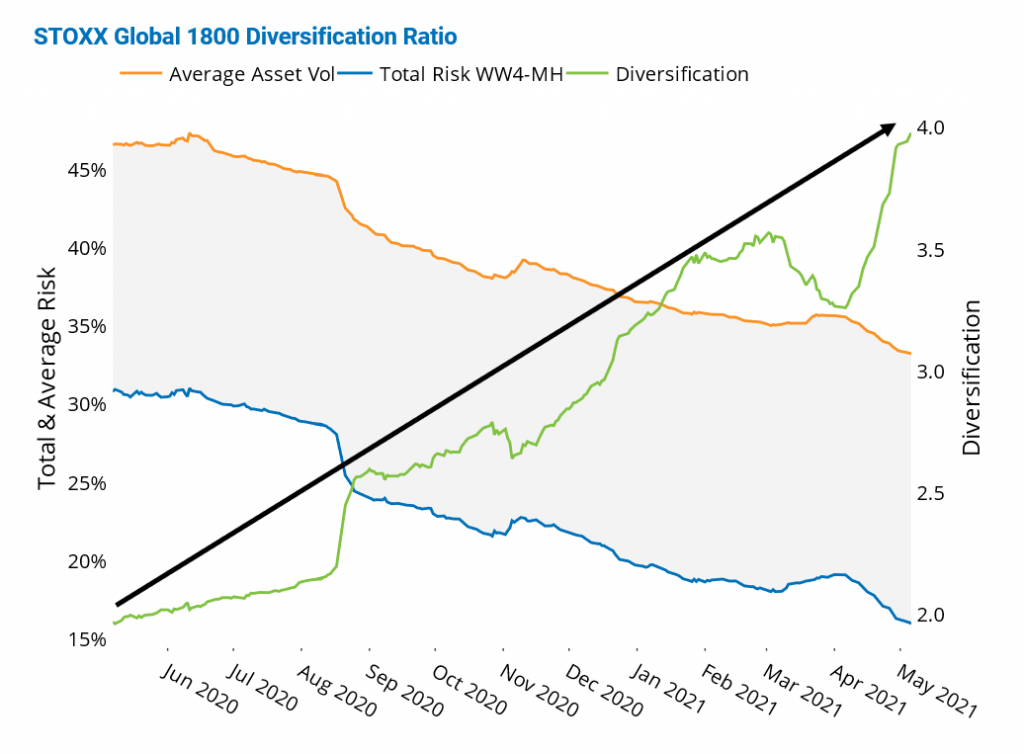
While trading activity remains low relative to levels of a couple of months ago, asset diversification is up globally. Asset diversification in the STOXX Global 1800 index climbed to new records last week, indicating that portfolio managers are in the best position to diversify their portfolios in about a year.
The asset diversification ratio is calculated as the weighted average asset variance for each stock in the index, divided by the total forecasted index variance, and measures the impact of correlations on total risk. Both 20-day and 60-day median realized correlations in the STOXX Global 1800 index have been extremely low year to date. Still, diversification remained well below the peak reached prior to the market meltdown in March of last year, when the ratio was above 5.0, as measured by Axioma’s Worldwide medium-horizon fundamental model.
See graph from the Global Developed Markets Equity Risk Monitor as of 6 May 2021:
For more insights and research from the Applied Research team, please click here.


