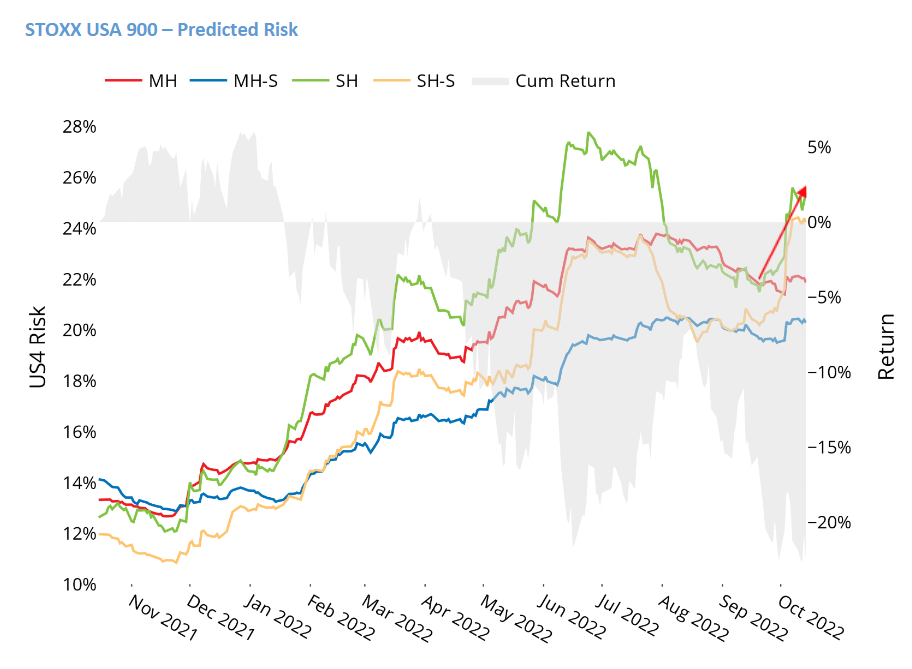
- Market see-sawing drives sharp increase in risk
- Investors seeking safer (factor) havens
- Despite eye-popping inflation prints, European Real Estate has seen poor returns and higher volatility
Market see-sawing drives sharp increase in risk
The US market rally from mid-June to mid-August this year, as measured by the STOXX® USA 900, was short lived, and the index price as of Friday, October 14 reached a new near-term low. The market has fallen more than 20% in the past 12 months, with brief but powerful recoveries offset by longer stretches of drawdowns. This see-sawing has been quite apparent recently as well: Half of the 10 days in the current quarter have seen market moves of +/- 2%. Intraday swings were even wilder, but even the close-close moves sent volatility higher. Short-horizon fundamental volatility for the index rose from 22.5% at the end of the third quarter to 25.4% on October 14, an almost 13% proportional increase. Looked at another way, the 20-day increase fell into the 86th percentile of risk changes over the past 10 years. So, while this has not been a historically high short-term uptick in volatility, it was certainly high enough for investors to be concerned.
See chart from the US Equity Risk Monitor as of 14 October 2022:
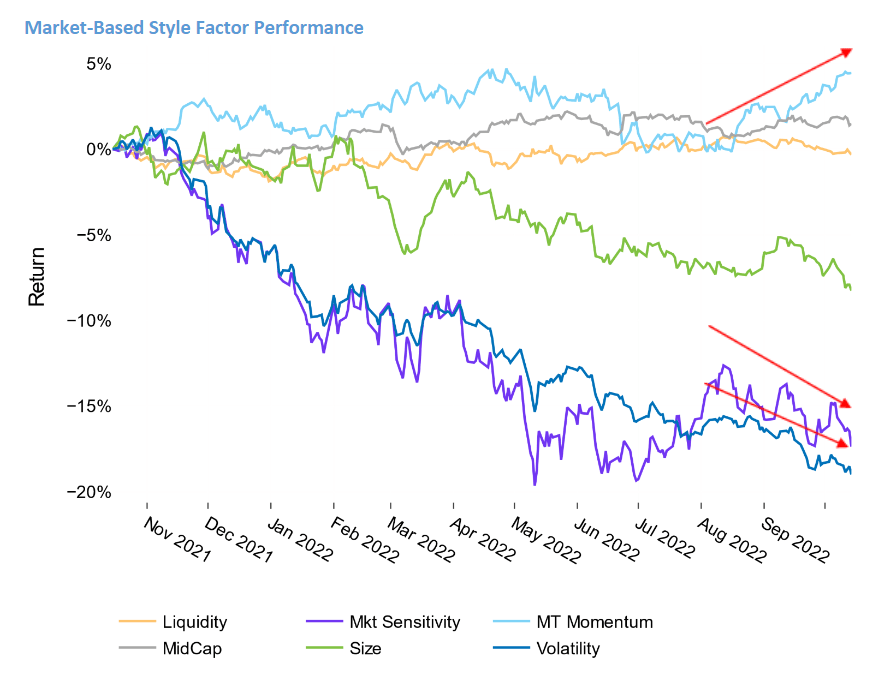
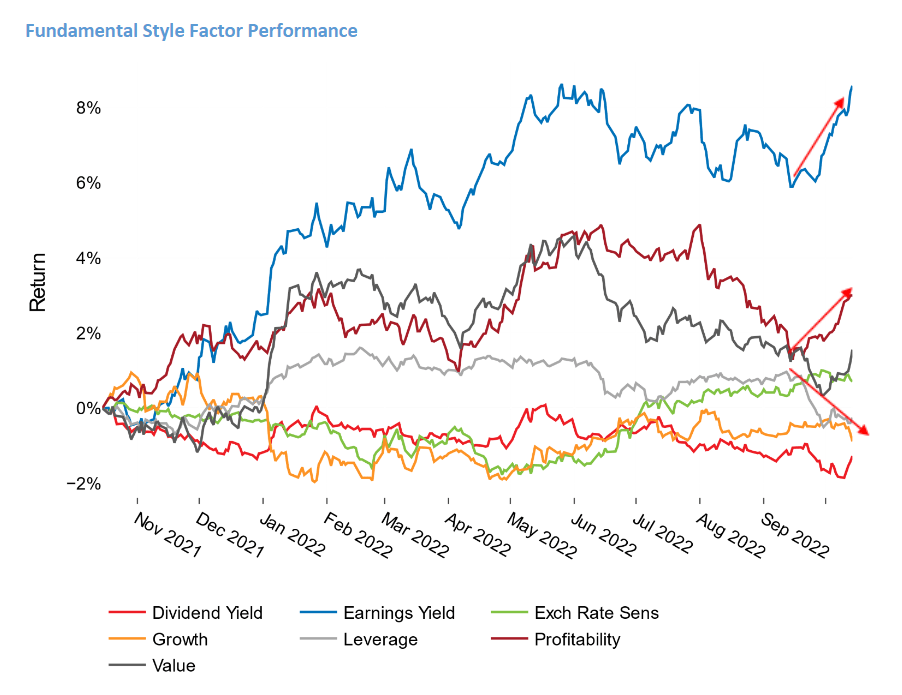
Investors seeking safer (factor) havens
Returns for a number of style factors in the US Axioma medium-horizon fundamental model have reversed course, and now reflect a more cautious stance. Earnings Yield, Value and Profitability returns have all turned sharply higher in the past few weeks, suggesting that investors are looking for cheaper, higher quality names. Of those, Earnings Yield’s gains are the most dramatic, more than two standard deviations above the long-term average monthly return, based on expected volatility at the beginning of the period. (And its 12-month return is almost four standard deviations above average.) Low Leverage has also been favored recently; the factor’s monthly return was more than two standard deviations below average.
While Volatility’s return has been steadily negative for most of the last 12 months (its -19% return is also more than two standard deviations below expectations from a year ago), Market Sensitivity’s return was sharply positive during the summer market recovery (producing a positive three-month return) but has trended back down with the market. Value and Profitability returns were positive for the past month, but not exceedingly so. Finally, despite the reversal in the above-noted factor returns, Medium-Term Momentum has continued on the positive path started in August.
See charts from the US Equity Risk Monitor as of 14 October 2022:
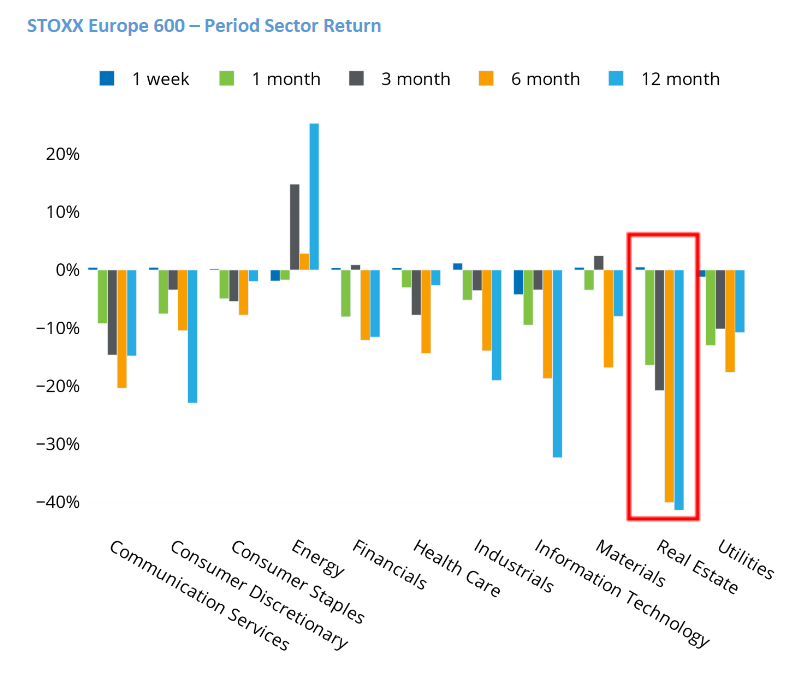
Despite eye-popping inflation prints, European Real Estate has seen poor returns and higher volatility
The Real Estate sector within the STOXX® Europe 600 index has seen worse returns than any other sector in the index (although Consumer Discretionary was not far behind) for the one-, three-, six- and 12-month periods ended last Friday, October 14. This return is puzzling, as Real Estate is often thought of as an inflation hedge and reported inflation in Europe has continued to outpace expectations. We attribute the relative weakness to 1) high energy prices and raw materials shortages, rather than economic growth and rising wages that would have enabled landlords and sellers to demand higher rents and sales prices and 2) the adverse effects of higher interest rates that are likely driving buyers away.
Real Estate has also moved from being in the middle of the risk pack among European sectors six months ago to being the riskiest currently. The sector’s current risk level of 33.5% is almost four percentage points higher than the next-riskiest—Information Technology. Finally, the relative risk ranking appears to be unique to Europe. In other markets, such as in the US, Real Estate’s risk falls closer to the lower end of the risk levels of the 11 GICS sectors, despite having the worst or second-worst returns for the past month, three months and six months.
See chart from the European Equity Risk Monitor as of 14 October 2022: