

Market Sensitivity and Volatility decouple
High beta stocks are no longer in lock step with high volatility stocks, as was the case in 2020 and earlier this year. Although Market Sensitivity’s return was nearly zero over the past three months and negative over the past six months, its 12-month return remains strongly positive. Market Sensitivity posted the second-highest positive 12-month cumulative return after Value, among all style factors in Axioma’s Worldwide medium-horizon fundamental model. That is, high-beta stocks outperformed low-beta stocks over the past 12 months.
In contrast, Volatility has recorded negative returns at the one-week and one-, three-, six- and 12-month horizons, despite being up substantially at the start of the 12-month period. In other words, high-volatility stocks have been underperforming their lower volatility counterparts strongly over the five horizons previously mentioned. For more details on style factor performance in the third quarter and the year to date, please watch the recording of the webinar Qontigo Insight™ Quarterly Risk Review Q3 2021, or contact us to request the slides.
See graph from the Global Developed Markets Equity Risk Monitor as of October 7, 2021:
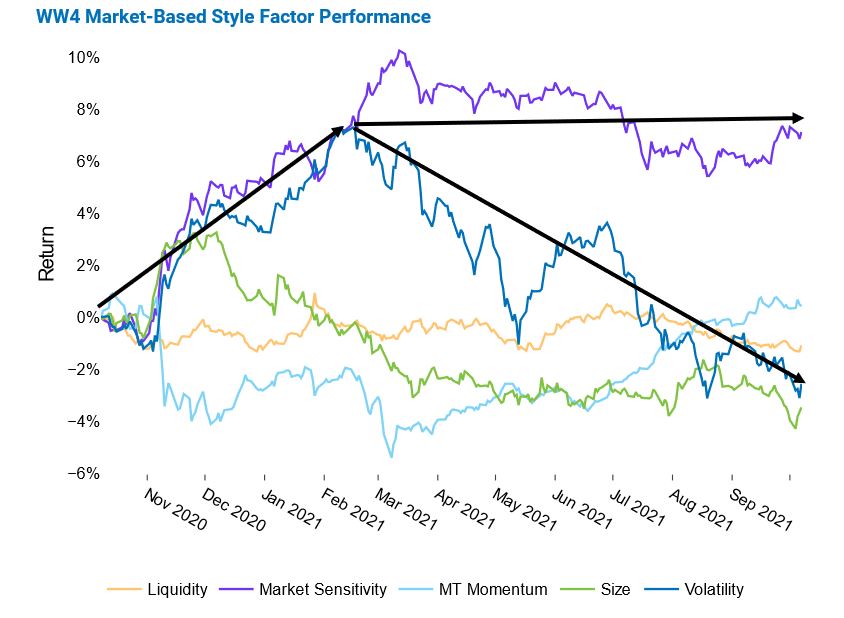
Note: Market Sensitivity measures the time series sensitivity of an individual stock, whereas Volatility is a measure of cross-sectional stock movements after accounting for Market Sensitivity. Because they are two distinct measures of how a stock moves that are relatively uncorrelated over the long term, we include both in the model.
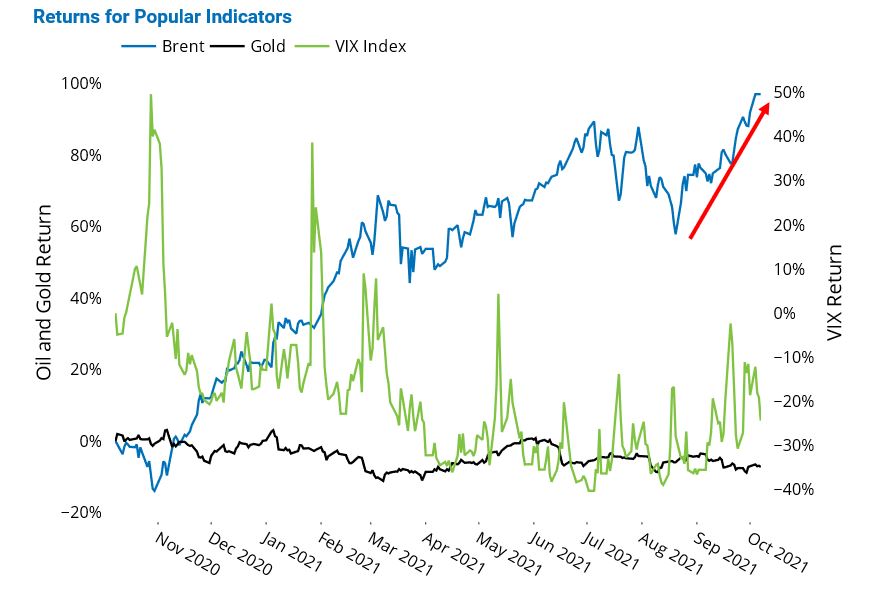
Energy fuels benchmark risk
Energy’s contribution to benchmark risk far exceeded its capitalization weight in most major benchmarks, following oil’s recent rally. The surge in oil prices was fueled by OPEC’s refusal to boost production, which sent prices to a seven-year high last week. Trading activity for stocks in the Energy sector rose above the one-year daily trading average, while Energy’s weight now exceeds its level of one year ago in most geographies Axioma models track closely.
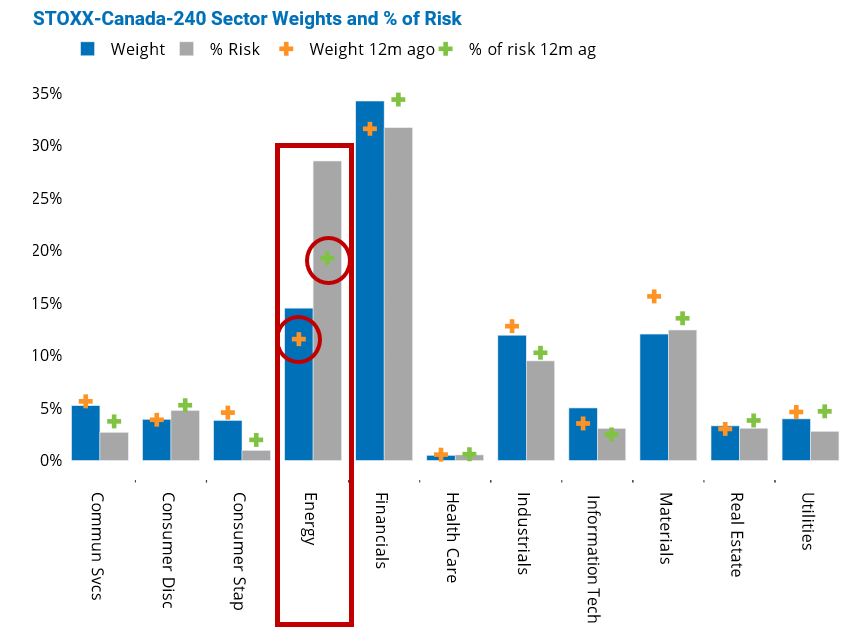
At the same time, Energy’s contribution to benchmark risk moved above its level of one year ago and was higher than what Energy’s weight would have otherwise suggested in most major benchmarks. The large moves in oil prices had significant implications for countries that rely heavily on this sector, such as Canada, where the Energy sector was the second largest after Financials. Energy’s contribution to the STOXX Canada 240 index’s risk was nearly double its weight in the Canadian index.
See graphs from the Canada Equity Risk Monitor as of October 7, 2021:
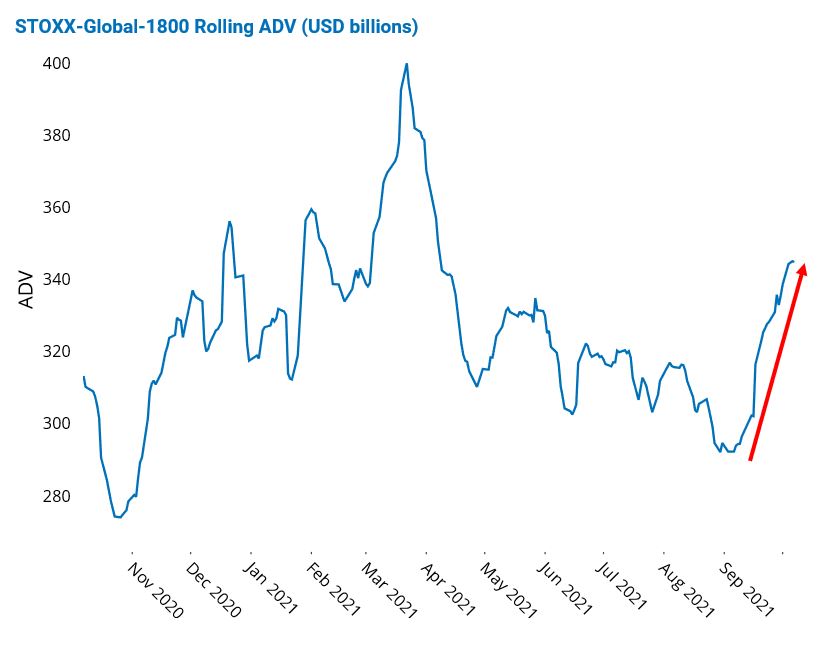
Trade volumes pick up
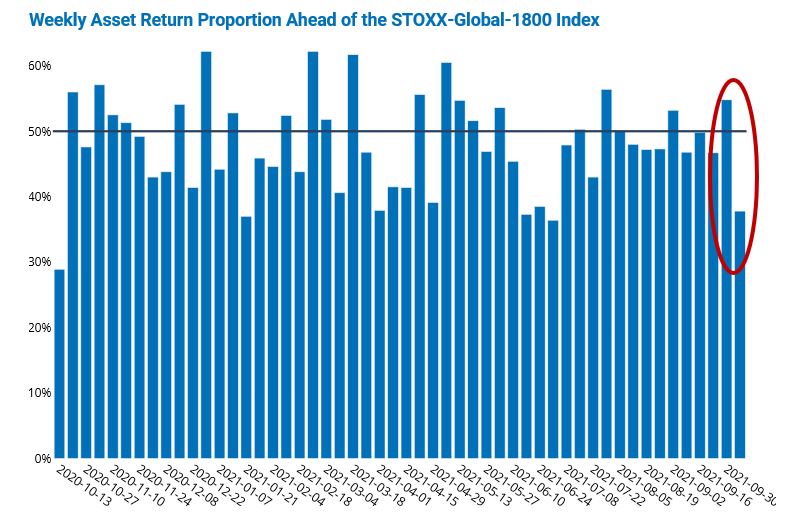
Trading volumes picked up in recent weeks, after dropping to a year-to-date low in early September. Although the average daily volume swelled for stocks in the STOXX Global 1800 index over the past month, they did not breach the highs seen in March of this year. The increase in trading activity paralleled falling markets, with the global index posting a negative monthly return of about 5% as of last Thursday, despite being slightly up for the past five business days. Interestingly, less than 40% of the assets in the STOXX Global 1800 beat the index last week, a dramatic shift from the prior week, suggesting once again that it was larger names that drove the global market.
See graphs from the Global Developed Markets Equity Risk Monitor as of October 7, 2021:
For more insights and research from the Applied Research team, please click here.


