
Only two weeks ago, the STOXX® Europe 600 Index was trading at a record high.1 Since then, concerns about the expanding coronavirus (COVID-19) outbreak and a collapse in oil prices have rocked investor sentiment. So sharp has the deterioration been that on Mar. 9 the index plunged more than 20% from its Feb. 19, 2020 high, entering what is popularly considered a bear market.
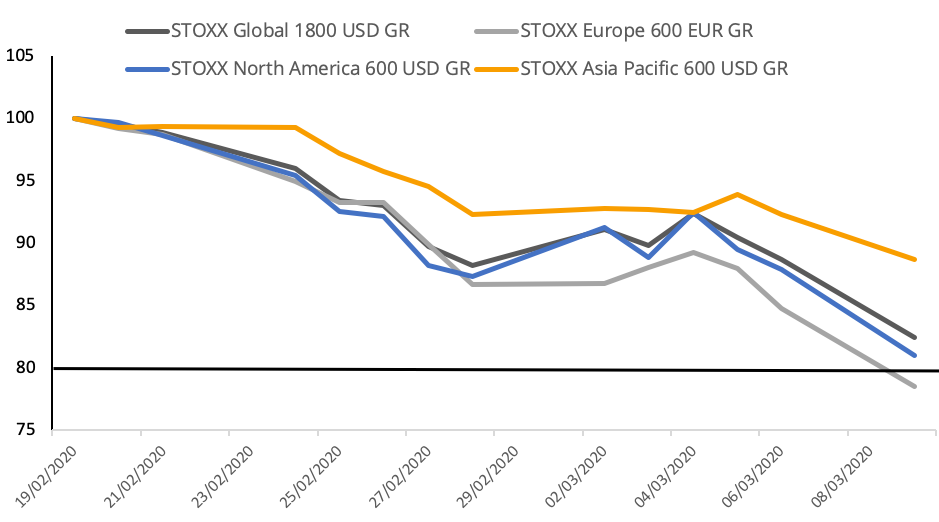
Chart 1 shows the performances of the European benchmark, the STOXX® Global 1800 Index, STOXX® North America 600 Index and STOXX® Asia/Pacific 600 Index since the close of trading on Feb. 19. The black line denotes the generally understood threshold for a bear market. The European index has lost 21.5% in the period through Mar. 9, falling to its first bear market since 2016. The Global 1800 Index, North America 600 Index and STOXX Asia/Pacific 600 Index have shed, respectively, 17.5%, 19% and 11.3% during the period.
Chart 1 – Benchmarks performance since Feb. 19
There have been three bear markets, other than this latest one, for the STOXX Europe 600 Index since 2000. The maximum drawdown during each one was reached, respectively, in March 2003 (-52.8%), March 2009 (-58.4%) and February 2016 (-24.9%).2
Stocks plunged on Mar. 7 this year after Italy imposed a virtual lockdown on activities in 15 provinces in the wealthy north of the country to contain what’s been Europe’s center of the Coronavirus outbreak. Markets were further shaken after Saudi Arabia unanimously decided to slash prices of its crude oil, following a breakdown of talks with Russia. The decision caused oil prices to tumble 25% overnight, raising concerns smaller and highly indebted producers may go bankrupt and trigger a credit crisis.
Economists continued to slash growth forecasts, with predictions now pointing to recessions this year in large nations including Italy and Germany.
The EURO STOXX 50® Volatility Index, or VSTOXX®, jumped to 54 from 16 on Feb. 21. The index is based on options prices on the EURO STOXX 50® Index and is designed to reflect the market expectations of near- to long-term volatility.
Oil and gas index leads losses
Table 1 shows the performance during the same period of 19 STOXX indices tracking each Supersector in the ICB classification. Not surprisingly, energy stocks have suffered the brunt of the selling. The STOXX® Global 1800 Oil & Gas Index tumbled 33.9% during the 13 trading sessions.
Table 1
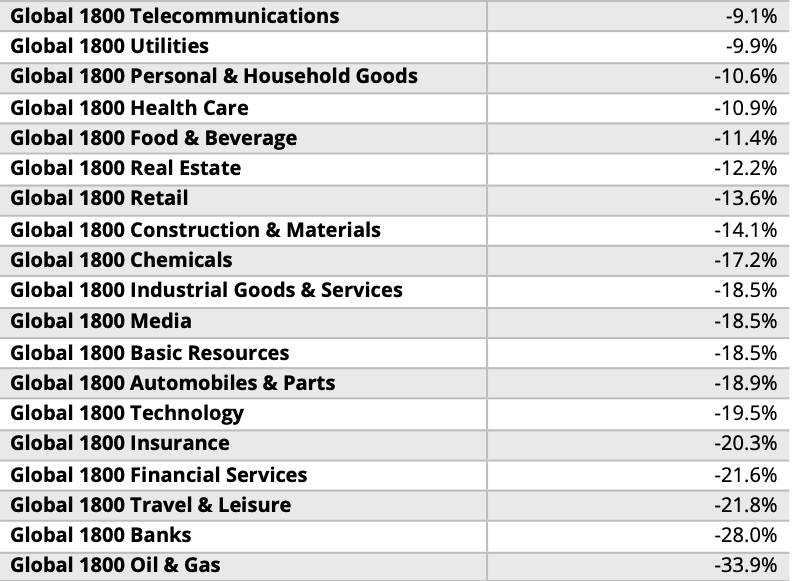
Source: STOXX index data. Based on STOXX® Global 1800 Index sector indices, gross return USD, Feb. 20, 2020 – Mar. 9, 2020.
Factor performance
Turning the attention to factor investing, Chart 2 displays the performance of the six STOXX Factor Indices tracking the STOXX Global 1800 to determine which investment styles weathered the downturn in better form.
Chart 2 – Factor returns
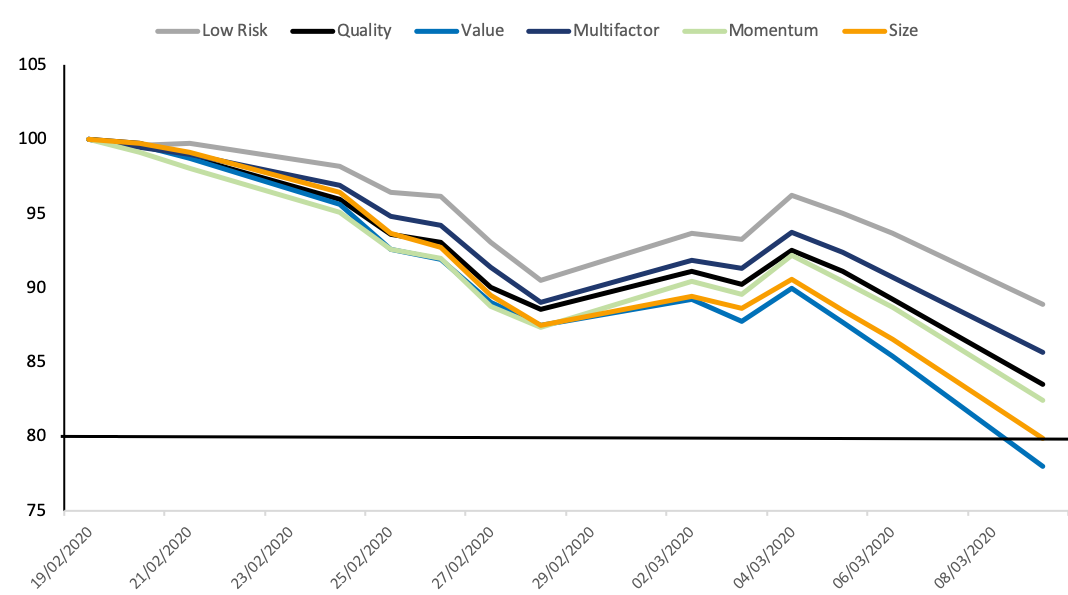
Value (-22%) and size (-20.1%) were the worst-performing factors during the period. Low risk, as measured by the STOXX® Global 1800 Ax Low Risk Index, fared the best in relative terms, but still fell 11.1%.
Market outlook unpredictable
Central banks from the US to the UK have moved fast to support the economy and financial markets in the wake of the health crisis and economic disruption, lowering interest rates. Some developed nations are also turning to fiscal easing, announcing more spending and investments to underpin activity.
Because the coronavirus is an exogenous and unpredictable source of market stress, strategists have warned that economic forecasts may be unreliable. Any market recovery will depend on the scope of monetary and fiscal responses from central banks and governments and, most importantly, on the speed at which the pandemic is overcome.
1 Measured in gross returns in euros.
2 We’ve considered a bear market as a drop of at least 20% from a previous peak, until a new peak is reached.


