

The market’s recent rout has led to a sharp increase in forecast risk (see Diana Rudean’s recent blog post). The good news for factor-based investors is that, with a few exceptions, the heightened volatility has not shown up in returns of a number of commonly-used factors—at least not yet. As we saw with benchmarks, factor volatility has generally, although not universally, increased as well.
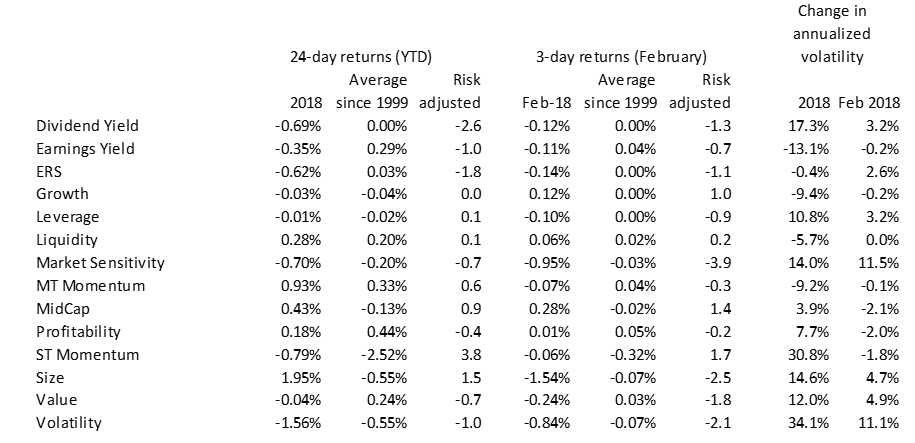
The table below details returns for the year-to-date period (through February 5) and for the three days of the intense market downturn (February 1-5). We also show the long-term average returns for the same periodicities and a risk-adjusted return (based on projected 24-day and 3-day volatility at the beginning of the period). Finally, we calculate the percentage change in risk.
A few factors stood out in one or both periods, with returns two or more standard deviations away from the long-term average. Dividend Yield—which was presumably hurt owing to investors seeking newly-higher yields in fixed income instruments, rather than wanting to take on equity risk—has fallen short thus far this year, but did not seem to take a particular hit recently (nor did it outperform, as one might have expected in a falling market). Its increase in volatility this year was third behind Short-Term Momentum and Volatility. Short-Term Momentum was the only other factor with a big move. In this case its return was a good deal less negative than one would expect given the long-term average return.
For the short-but-intense period thus far in February, three factors stood out with unusually big risk-adjusted returns. The first two were not surprising. Market Sensitivity posted a large negative return, meaning that lower beta stocks fared better than their higher-beta counterparts, which is to be expected when the market is down as much as it has been and investors are looking to lower their overall risk. Similarly, lower Volatility stocks fared far better than higher-Volatility names. The volatility of both factors increased a similar amount in February, while the Volatility factor had already seen a sharp increase in its riskiness.
Finally, the Size factor staged a sharp reversal, rising almost 2% year-to-date, meaning that larger stocks posted larger gains than smaller stocks. The factor’s return in January was the highest since at least 1999 for a one-month period. As the market sold off, however, it is likely that investors sold what they were able to sell, namely larger stocks, pushing their returns well below those of smaller names.
None of these factors’ returns was particularly surprising in this market environment, and we view that as good news, at least for factor-based investors, who hopefully did not see their portfolios underperform an already-down market.
1 Risk-adjusted returns are calculated as the period return minus the long-term average return, divided by the volatility
2 End-of-period annualized risk/beginning of period -1


