

Stocks rose for a sixth straight month in July, as ongoing optimism that the global economy and corporate profits are rebounding outweighed concerns about a reacceleration of the COVID-19 pandemic. Asian stocks dropped.
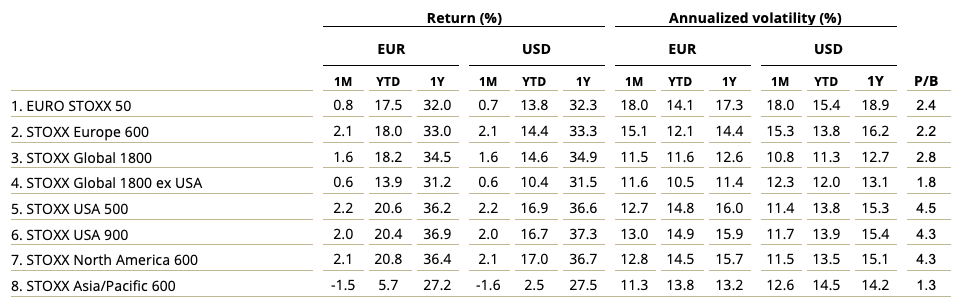
The STOXX® Global 1800 Index gained 1.6% in the month when measured in dollars and including dividends,1 taking its gain so far this year to 14.6%. The index also climbed 1.6% in euros during the month. Excluding dividends, the index extended its all-time high.
The pan-European STOXX® Europe 600 Index increased 2.1% in euros in the month, also a sixth monthly gain. The index reached a new record high when excluding dividends.2 The Eurozone’s EURO STOXX 50® Index climbed 0.8% and still traded at its highest level since January 2008 on a price basis. The STOXX® North America 600 Index rose 2.1% in dollars. The STOXX® Asia/Pacific 600 Index, however, decreased 1.6%, a second consecutive monthly retreat.
Figure 1 – Benchmark indices’ July risk and return characteristics
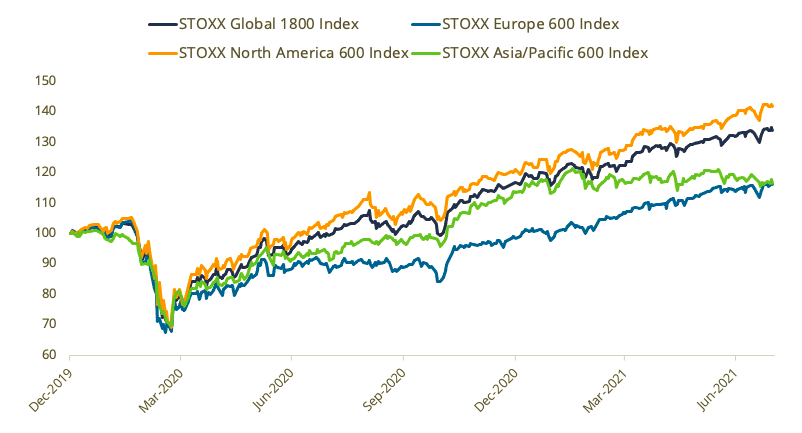
The STOXX Global 1800 rose 16.9% last year as investors raised expectations that policy support and vaccines will help economies overcome the pandemic-induced slump. The index is poised for its ninth annual advance in the past ten years, posting a yearly average gain of 13.2% over the period.
Figure 2 – Returns since Jan. 1, 2020
| For a complete review of all indices’ performance last month, visit our July index newsletter. |
July wasn’t all smooth sailing for markets. The STOXX Global 1800 index dropped 1.6% on Jul. 19 on news that the novel Delta coronavirus variant is leading to an acceleration in contagions. Investors worry the pace of economic growth is slowing, but balance off those concerns with increased expectations that central banks will keep supportive monetary policies in place. In China, stocks fell as the government tightened its regulation of the technology and education sectors. On a more positive note, about 89% of US companies that have released their latest quarterly earnings have beaten analysts’ expectations.3
Volatility ticks higher
The EURO STOXX 50® Volatility (VSTOXX®) Index, which tracks EURO STOXX 50 options prices, rose to 20.9 at the end of last month from 18.2 in June. A higher reading suggests investors are paying up for puts that offer insurance against stock price drops. The VSTOXX climbed to 86 in March 2020 as many countries imposed restrictions on work and everyday activities.
Developed and emerging markets
Sixteen of 25 developed markets tracked by STOXX advanced during July when measured in dollars. The STOXX® Developed Markets 2400 Index climbed 1.4% in both dollars and euros.
The inverse trend took place in emerging markets. Fourteen of the 21 national developing markets posted a loss for the month when measured in dollars. The STOXX® Emerging Markets 1500 Index slid 2.9% in both dollars and euros.
Basic Resources on top, energy struggles
Fourteen of 20 Supersectors in the STOXX Global 1800 advanced in the month. The STOXX® Global 1800 Basic Resources Index (+5.3%)4 rebounded from the worst slot in June to top of the league in July. The STOXX® Global 1800 Energy Index (-6.5%) came out last in July.
Investors snub Value shares
Value trailed as a factor signal across regions last month, according to the STOXX Factor Indices. The STOXX® Global 1800 Ax Value Index retreated 0.5%, underperforming for a second straight month. Multi-Factor took the lead in July among factor strategies covering global markets.
Figure 3 – STOXX Factor (Global) indices’ July risk and return characteristics
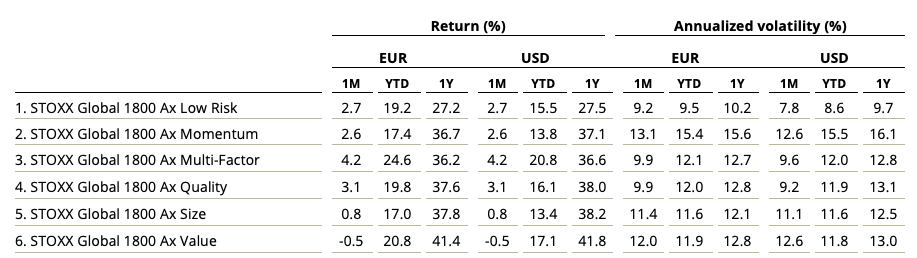
On a regional basis, gains were led by the STOXX® Europe 600 Ax Multi-Factor Index (+4.8%), STOXX® USA 900 Ax Multi-Factor Index (+4.2%) and STOXX® Asia/Pacific 600 Ax Low Risk Index (+0.4%).
The STOXX® Global 1800 ESG-X Ax Multi-Factor Index (+4.2%) led returns in July among the Global ESG-X Factor Indices. The indices apply the same factor approach as the Global Factor Indices but additionally exclude companies involved in controversial activities from a sustainability point of view.
ESG-X and ESG integration indices
The STOXX® ESG-X indices, which are versions of traditional, market-capitalization-weighted benchmarks that observe standard responsible exclusions of leading asset owners, had similar performances to benchmarks during July. The STOXX® Global 1800 ESG-X Index rose 1.6%.
Within indices that combine exclusions and ESG integration, the EURO STOXX 50® ESG Index (+1.3%) extended its outperformance streak to beat its benchmark by 56 basis points in July. The DAX® 50 ESG Index, which excludes companies involved in controversial activities and integrates ESG scoring into stock selection, was unchanged over the month and hence slightly underperformed the benchmark DAX (+0.1%).
Sustainability indices
Among other families in the STOXX sustainability index framework, the STOXX® Global 1800 ESG Broad Market Index (+1.9%) topped its benchmark during July. The STOXX ESG Broad Market Indices apply a set of compliance, product involvement and ESG performance exclusionary screens on a starting benchmark universe until only the 80% top ESG-rated constituents remain. Companies that are non-compliant based on the Sustainalytics Global Standards Screening assessment or are involved in controversial weapons are not eligible for selection. Additional filters exclude companies involved in tobacco production, thermal coal and military contracting.
Next, the STOXX® Global 1800 ESG Target Index added 1.7% in July and the EURO STOXX® ESG Target Index rose 1.4%. The DAX® ESG Target Index decreased 0.3%. The STOXX and DAX ESG Target Indices seek to significantly improve the benchmark portfolio’s ESG profile, while mirroring its returns as closely as possible. The indices follow a similar initial selection methodology as the STOXX ESG Broad Market Indices. From that selection pool they implement, through a series of constraints, an optimization process to maximize the overall ESG score of the portfolio while constraining the tracking error to the benchmark.
The STOXX® Global 1800 ESG Target TE Index, meanwhile, rose 1.7% and the EURO STOXX® ESG Target TE Index added 1.5% last month. The STOXX ESG TE Indices follow a similar methodology to the ESG Target Indices, but the optimization imposes a tracking error minimization, subject to a constraint of improving the ESG score of the resulting portfolio.
Finally, the STOXX® Global 1800 SRI Index (+2.6%) returned 1 percentage point more than the benchmark STOXX Global 1800 Index. The STOXX SRI indices apply a rigorous set of carbon emission intensity, compliance and involvement screens, and track the best ESG performers in each industry group within a selection of STOXX benchmarks. In the month that ended, the SRI indices produced returns that topped those of benchmarks.
Climate benchmarks
There were strong performances from the STOXX Paris-Aligned Benchmark Indices (PABs) and the STOXX Climate Transition Benchmark Indices (CTBs) covering the global and US markets. The STOXX® Global 1800 PAB Index and the STOXX® Global 1800 CTB Index both gained 2%. The indices were introduced last year and follow the requirements outlined by the European Commission’s Technical Expert Group (TEG) on climate benchmarks.
Among the STOXX Low Carbon Indices, the EURO STOXX 50® Low Carbon Index (+0.5%) underperformed the EURO STOXX 50 by 30 basis points last month. Elsewhere, the STOXX® Global Climate Change Leaders Index (+2%), which selects corporate leaders that are publicly committed to reducing their carbon footprint, returned 42 basis points more than the STOXX Global 1800 Index during the month.
Thematic investing shows underwhelming returns
The STOXX® Thematic Indices had weak relative performances last month. The indices seek exposure to the economic upside of disruptive global megatrends and follow two approaches: revenue-based and artificial-intelligence-driven. Fifteen of 22 revenue-based thematic indices underperformed the STOXX Global 1800 Index during the month. The STOXX® Global Smart City Infrastructure Index (+3.6%) came out at the top of the ranking. The STOXX® Global Video Gaming & eSports Index’s 3.8% retreat was the poorest showing in the group.
The three STOXX artificial-intelligence-driven thematic indices underperformed the benchmark: the STOXX® AI Global Artificial Intelligence Index and its ADTV5 version fell 0.3%, while the iSTOXX® Yewno Developed Markets Blockchain Index increased 0.5%.
Dividend strategies
For a second straight month, the dividend strategies tracked by STOXX had poor returns as investors weigh the prospect of higher interest rates.
The STOXX® Global Maximum Dividend 40 Index (+0.4%) selects only the highest-dividend-yielding stocks. The STOXX® Global Select Dividend 100 Index (+0.2%), meanwhile, tracks companies with sizeable dividends but also applies a quality filter such as a history of stable payments. The STOXX® Global ESG-X Select Dividend 100 Index (+0.1%) was introduced last February and targets the highest-yielding stocks within universes screened for responsible investment criteria.
The STOXX® Global Select 100 EUR Index, which blends increasing dividend yields with low volatility and is calculated in euros, advanced 2.5%.
Minimum variance
Minimum variance strategies had strong relative returns last month. The STOXX® Europe 600 Minimum Variance Index rose 4%, the widest edge to the benchmark in any month since March 2020. The STOXX® Europe 600 Minimum Variance Unconstrained Index increased 3.8%
The STOXX® Global 1800 Minimum Variance Index (+3.2%) returned twice as much as the benchmark, although the unconstrained version of the MinVar index (+0.7%) underperformed. The STOXX® USA 900 Minimum Variance Index climbed 3.4% and the STOXX® USA 900 Minimum Variance Unconstrained Index rose 2.3%.
The STOXX Minimum Variance Indices come in two versions. A constrained version has similar exposure to its market-capitalization-weighted benchmark but with lower risk. The unconstrained version, on the other hand, has more freedom to fulfill its minimum variance mandate within the same universe of stocks.
1 All results are total returns before taxes unless specified.
2 Throughout the article, all European indices are quoted in euros, while global, North America, US, Japan and Asia/Pacific indices are in dollars.
3 Reuters, ‘Wall Street falls with Amazon; S&P 500 posts sixth straight month of gains,’ Jul. 31, 2021.
4 Figures in parentheses denote last month’s gross returns.


