

To say that fundamental style factor returns have been unusual this past week would be the understatement of the year—the decade, in fact. As reported in yesterday’s blog post “Momentum Nosedives”, Momentum had a greater-than two standard deviation month-to-date negative return in seven of the eleven markets we track. Conversely, Value, which has been underperforming year-to-date everywhere except Australia and emerging markets, has seen a stronger-than two standard deviation month-to-date positive return in four of those markets. The growth factor also saw a sharp reversal of fortune last week in the US, while leverage had a stronger-than two standard deviation positive return in that market on the hopes for more monetary easing by the Fed.
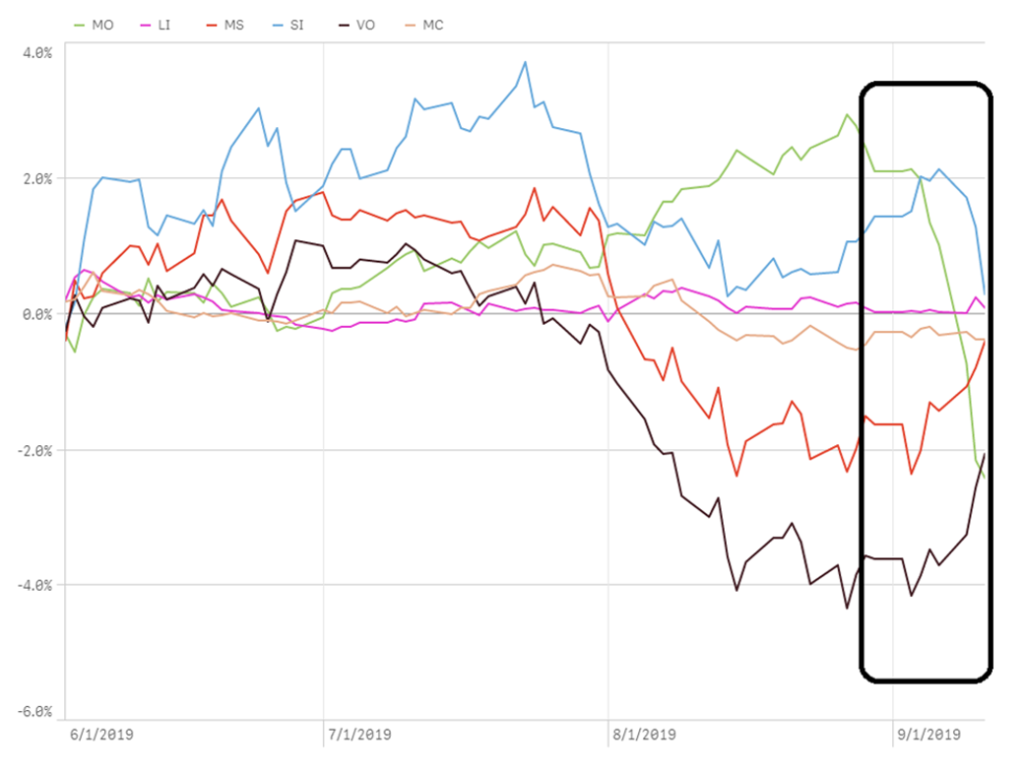
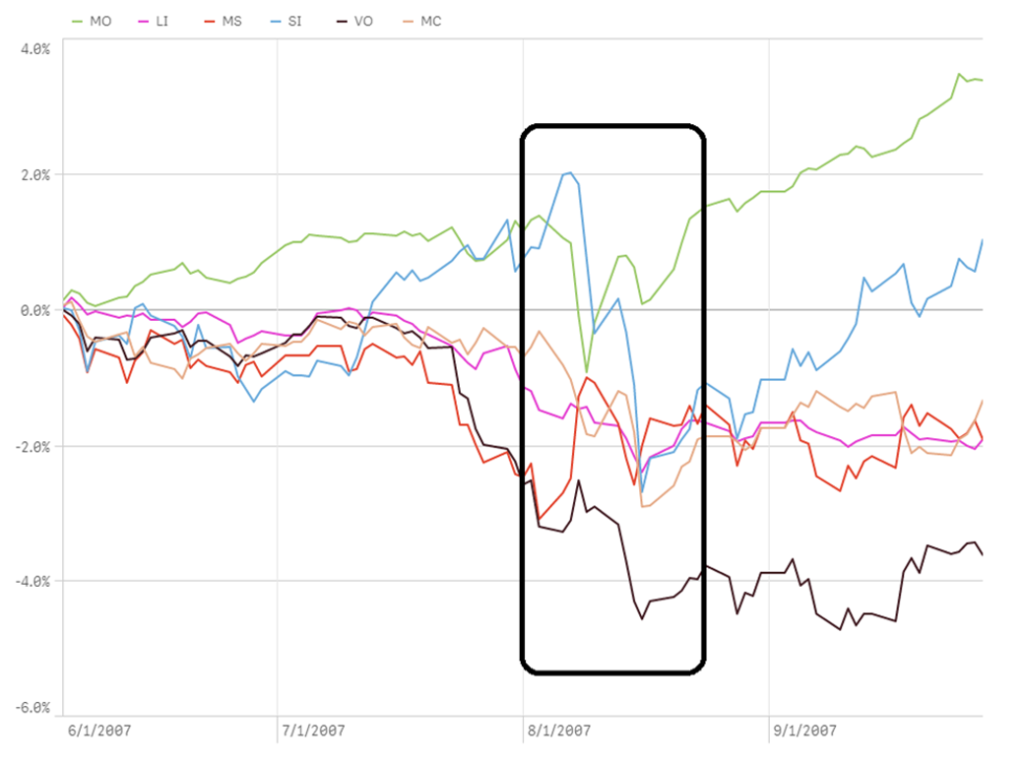
Many have drawn a parallel between this month and what happened in July of 2007. The charts below show the disruption in factor returns for the US market this month and in July 2007. Style factors are grouped into two sets, technical factors and fundamental factors, for easier identification[1].
Technical Factors Cumulative Return for US Model from: 06/03/2019 to 09/11/2019
Technical Factors Cumulative Return for US Model from: 06/04/2007 to 09/28/2007
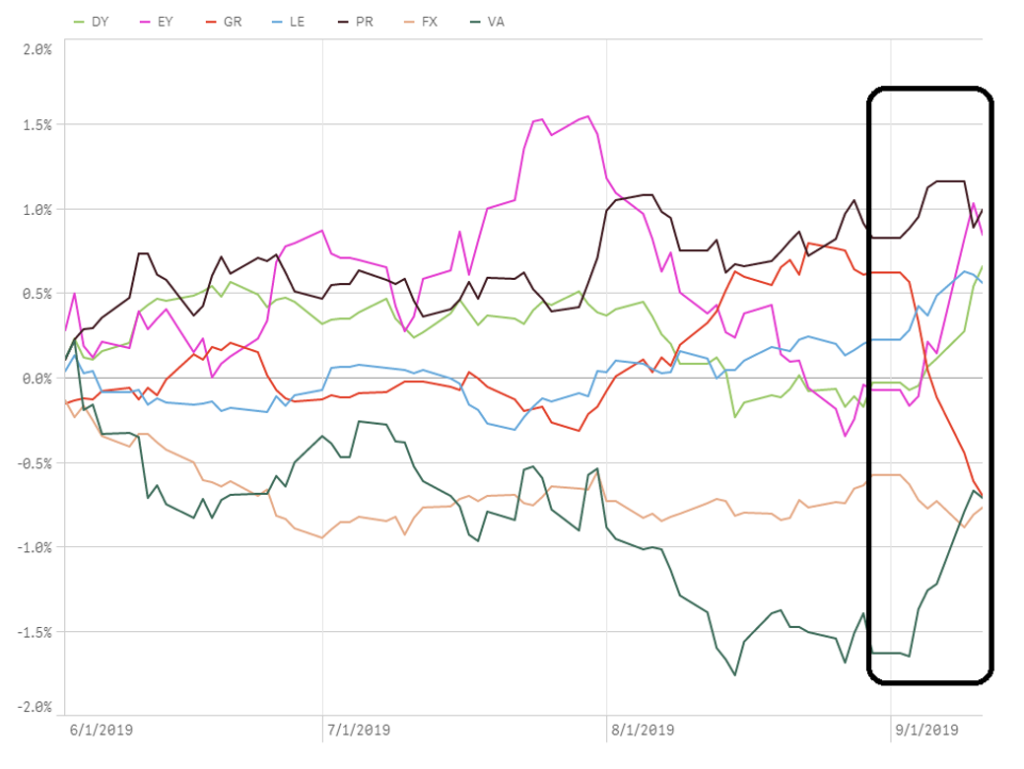
Fundamental Factors Cumulative Return for US Model from: 06/03/2019 to 09/11/2019
Fundamental Factors Cumulative Return for US Model from: 06/04/2007 to 09/28/2007
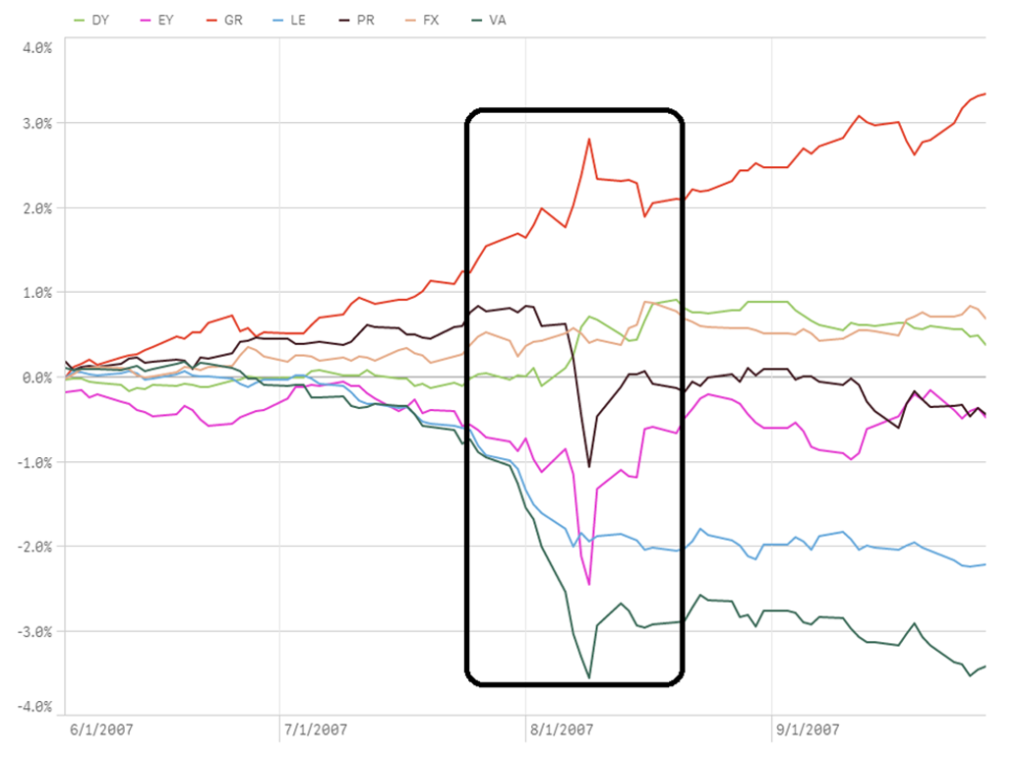
While factor returns were sharply down for Momentum and Size—and sharply up for Earnings Yield and Dividend Yield—in both this month and in the disruption of the first week of July 2007, this is where the similarities end. Value is sharply up in 2019, but was down in July 2007. Growth is down in 2019, but was up in 2007. Profitability—virtually flat last week—was sharply down in 2007. We would also note that in 2007, all these factors experienced sharp reversals of their factor returns in the following weeks, with most returning to trend.
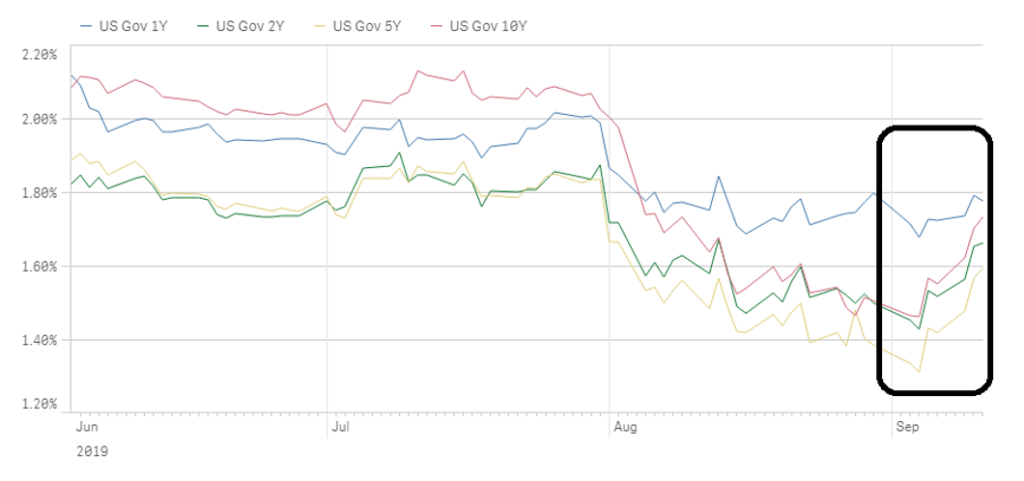
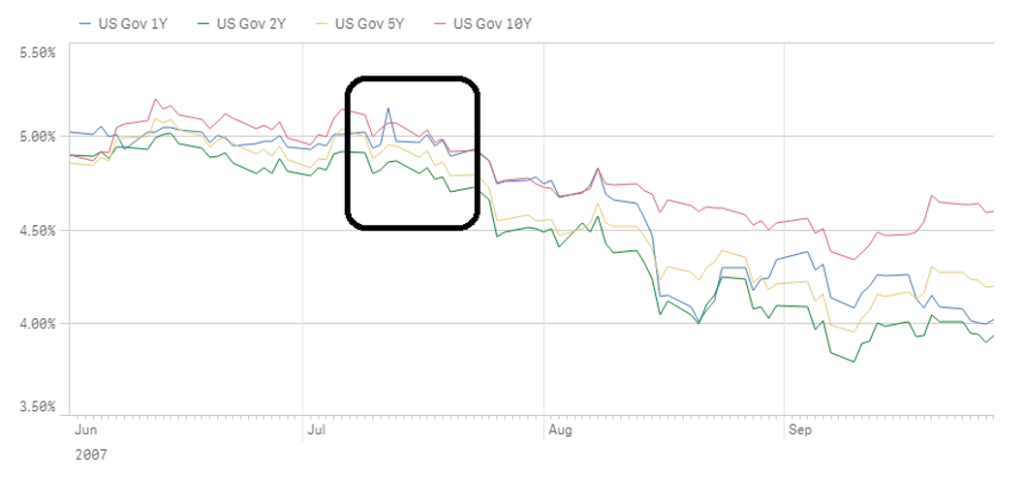
The other big difference, external to the equity factor world, has to do with bond yields. The two charts below contrast the US Treasury bond yield for the 1, 2, 5, and 10-Year TB in 2019 and 2007. This year, bond yield dropped sharply prior to the factor-return disruption. In contrast, in 2007 bond yields dropped sharply after the factor disruption. Treasury yield was also above 4.5% in 2007, versus below 1.8% today. This is significant since the weighted average dividend yield for the S&P 500 was 1.86% then, same as it is today, meaning equities did not compete with treasuries back then as a source of yield, as they do today.
Putting this year’s disruption into context, we have had a consensus for lower interest rates—by both the Fed and the ECB—since early June, a growing unease about the health of the global economy due to the ongoing trade war, continued geopolitical uncertainty, and a much sharper-than-anticipated rally in safe-haven assets (i.e., treasuries, Gold, JPY, etc.) during the past four months, with yield on the 10-year TB dropping from 2.5% in early May to a low of 1.5% in early September. Investor sentiment has also been shaken and remains more risk averse than risk tolerant. In short, what went up this year rose too much, what went down fell too low, and a big injection of QE liquidity is coming our way.
The combination of factor returns does not point to any particular strategy[2]. Therefore, what is a more likely explanation for this past week’s factor returns is that short-term investors are punting by buying this year’s recent losers (i.e., Value and Dividend Yield), and selling this year’s recent winners (i.e., Momentum and Growth) via a contrarian strategy ahead of a potential QE-induced liquidity rally, probably with the intention of reversing those trades in a few weeks.
Neither economic data, investor sentiment, CEOs, nor geopolitics are providing confidence for a long-term forecast, but what we do know is that interest rates are again on the way down, volatility on the way up, and average daily volumes anemic. In these conditions, a punt is all there is and if that’s what you’re after, then a contrarian strategy on the aforementioned factors, especially after such extreme performance, seemed like the least risky bet to take[3]. The last time punters tried this was late March this year. They sold momentum and bought value, only to reverse those trades a few weeks later and see factor returns revert to their previous trend.
We do not see September 2019 in the same light as July 2007, which prefaced the ensuing demise of quantitative strategies vis-à-vis their fundamental counterparts. History is not repeating itself—though it may be rhyming a bit.
[1] Key: MO=Momentum, LI= Liquidity, MS=Market Sensitivity, SI=Size, VO=Volatility, MC=Mid-Cap Factor, DY=Dividend Yield, EY=Earnings Yield, GR=Growth, LE=Leverage, PR=Profitability, FX=Exchange Rate Sensitivity, VA=Value
[2] E.g. if you are bullish on the economy, then why sell Growth? If you are bearish on the economy, then why buy small caps?
[3] I.e., when in doubt, bet on mean reversion.


