

“How would you model a trade war?” It’s a question that’s being asked a lot lately, thanks to actions by the Trump administration. In this article, we examine the impact of a potential trade war on a global multi-asset class model portfolio—first from an ex-ante risk point of view and then by applying a stress test.
Let’s start with the good news: the scenario is relatively straightforward and easy to model. As the trade war has already started, we know how markets are likely to react to a further escalation. When Donald Trump announced the first set of levies on $60bn of Chinese imports on March 22, the initial response was an almost 5% drop in US stocks, with the dollar depreciating around 1.5% against both the yen and the euro. At the same time, the 10-year Treasury yield plummeted 8 basis points, extending its total decline to 17 basis points over the next 2 weeks. With the short end still held up by rate hike expectations and inflation concerns, this resulted in the flattest US government curve in over a decade.
This is typical “flight-to-quality” behaviour—very similar to what we saw in times of geopolitical tensions over the course of 2017. In this type of scenario, investors tend to sell their riskier equity holdings and move their funds into the relative safety of government bonds. Usually, the currency of the affected region can be expected to depreciate, as foreign investors repatriate their capital. In the case of Axioma’s global multi-asset class model portfolio (which is based in USD), this meant that stock market losses were offset by bond price gains and an appreciation of non-USD assets. This, in turn, resulted in significant diversification and reduced overall risk.
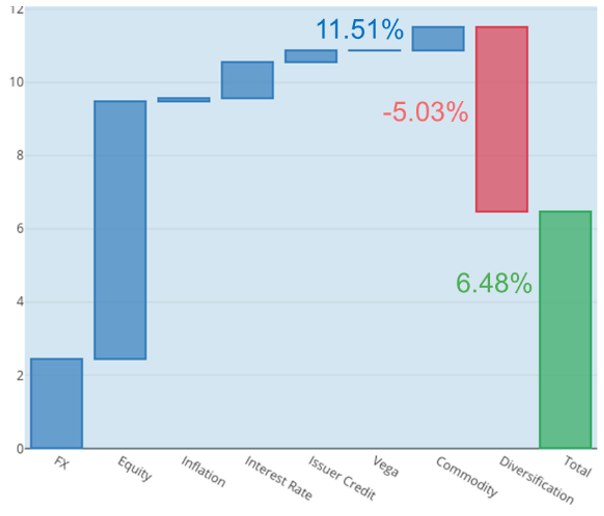
The chart below shows the short-term risk of the model portfolio as of April 6, 2018, broken down by major risk factor types. The blue bars indicate the would-be contributions, if all factor types were perfectly positively correlated. In this case, total portfolio risk would have been 11.5%, with almost two thirds coming from the elevated equity volatility at the time. However, there is also considerable diversification (represented by the red bar) from a negative correlation between equity and foreign currency returns, as well as an inverse relationship of stock and bond prices, reducing overall volatility to just 6.5%.
The risk numbers above are based on 60 daily returns ending April 6, thus encompassing both the onset of the trade war and the stock market correction in early February. This makes it an ideal calibration period for a stress test to measure the impact of a trade and an ensuing flight-to-quality. The next step will now be to choose the variables to shock and by how much. According to our recent whitepaper Stress Testing Best Practices, the modelled “scenarios can be extreme but should always be plausible.” For the purpose of this exercise, we assume a 15% drop in US equities, a 10% decline in Chinese stocks and a 5% depreciation of the USD against a basket of foreign currencies.
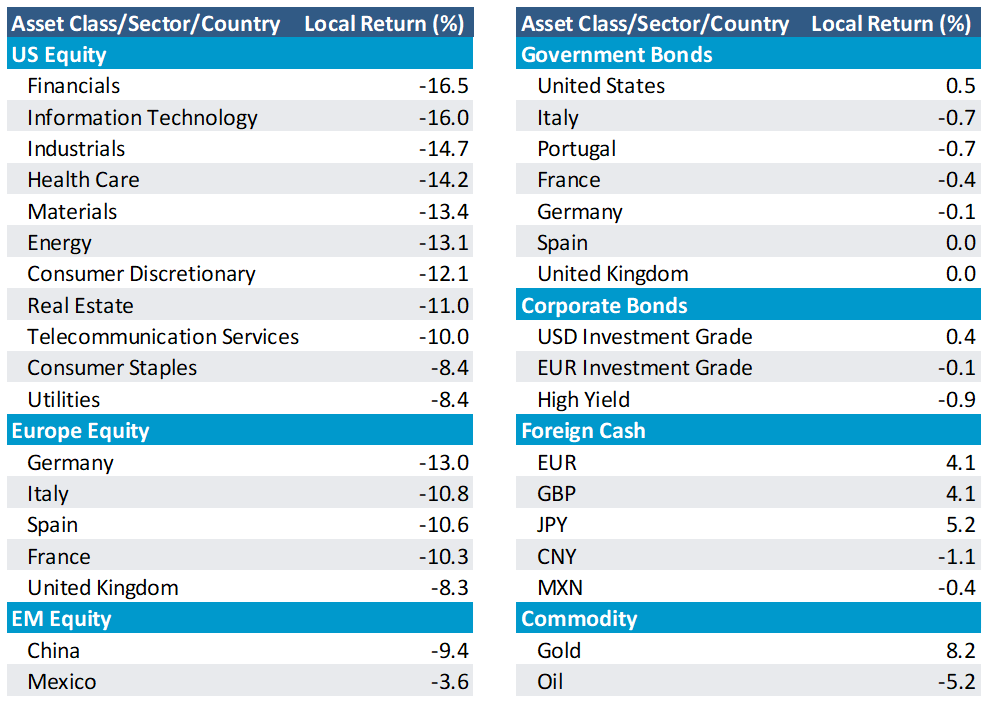
The table above shows selected results from the global multi-asset class portfolio. The portfolio is denominated in USD, but the returns are shown on a local basis, excluding exchange rate changes. The US equity portion is broken down by sectors, while the remaining stock and government bond returns are shown by country. The foreign cash returns are against the US dollar.
The yen shows the biggest gain, although the euro and pound also profit from the greenback’s weakness. The Chinese yuan and Mexican peso, on the other hand, depreciate in value. The stock markets in these two countries also show losses, although they appear to be less pronounced than in Europe. In the Eurozone, equity drawdowns seem to be fairly even around 10-11%, with the exception of Germany, which shows a negative return of 13%. In the United States, the financial, IT and industrial sectors suffer the biggest losses, while consumer staples and utilities seem to be hit less hard. Among fixed income assets, US Treasuries and investment grade bonds appear to provide the best hedge, while fiscally weaker Eurozone countries and high-yield bonds are adversely affected by widening spreads. Gold presents the highest positive return, while oil is dragged down by falling share prices.
The recent focus on Europe meant that European currencies have been slightly positively correlated with global stock markets. This resulted in a higher volatility contribution from non-US equities in Axioma’s model portfolio. But because the risk was mostly of a political nature, it also meant that fixed income securities provided good diversification against share price losses. However, given the fluctuating nature of multi-asset class correlations over the past couple of months, markets could fall back into “flight-to-quality” mode relatively quickly.
To learn more about the stress-testing capabilities of the Axioma Risk™ multi-asset class risk management platform, see here or contact sales@axioma.com.


