

Momentum has taken a beating from observers lately, thanks to the apparent recent breakdown in performance. But this situation is worth a closer look, as there may be a bit more going on here than meets the eye.
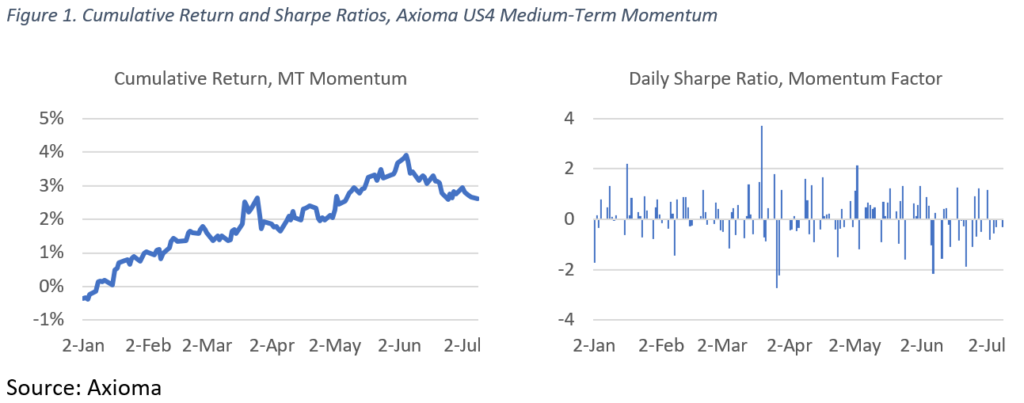
Performance of Axioma’s US Medium-Term Momentum factor[1], while disappointing since mid-June after a strong 18-month run, hardly looks disastrous. To be sure, returns have fallen off since early June (Figure 1). And while Sharpe Ratios of daily returns[2] have been negative more than 60% of the past 26 days, no one day has been exceedingly negative, and the cumulative return since June 1 has been -0.80%—not great, but less than one standard deviation, given the volatility at the beginning of the period.
Another way to assess factor returns is to look at how returns of the highest-ranked stocks on a factor compare with those that ranked poorly—in other words, look at quintile spreads. Although this method may confuse returns that are the result of exposure to the factor in question with those that come from incidental bets (e.g. the top Momentum quintile may be overloaded with technology stocks), it is nonetheless how many style-based managers think about those factors. Therefore, our next step was to calculate returns for the top and bottom quintile of Russell 1000 stocks based on their Medium-Term Momentum score[1], as well as the difference (the “quintile spread”). Figure 2 shows that the top quintile was the clear winner for much of the year, far outpacing the benchmark, whereas the bottom quintile lagged. When we limit the test period to June 1, 2018 through July 9, the picture looks quite different, with the bottom quintile substantially outperforming the up-and-down market and the top quintile remaining fairly flat.
The spread between the top and bottom quintile was therefore positive much of the year but fell almost eight percentage points from early June. Note that the quintile spread and the factor return followed a very similar pattern this year, but the magnitude of each was quite different (the factor is plotted against the right scale).
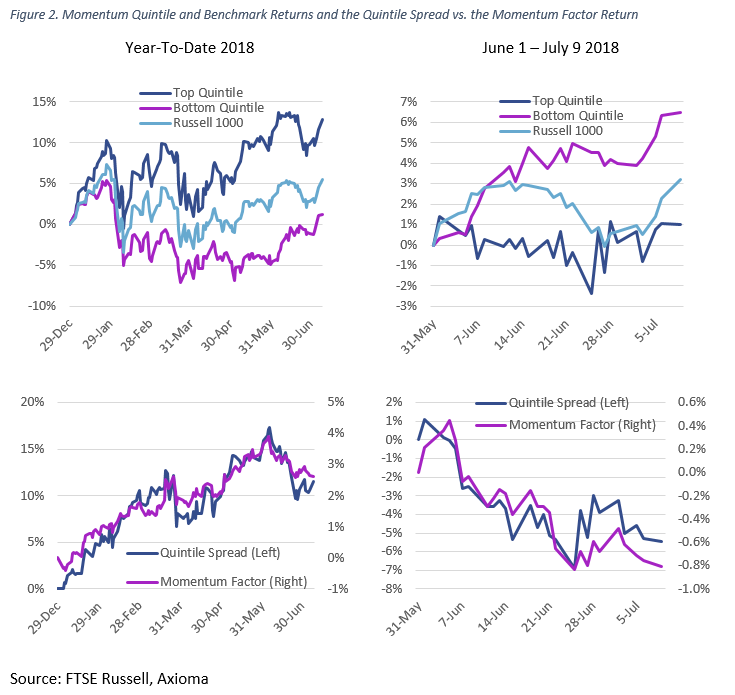
To us, both the factor return and the quintile spread suggest investors were rotating out of high momentum stocks into those that had not been strong over the past year. An attribution analysis of the spread since June 1 shows that it was not only the exposure to Momentum that hurt the top quintile relative to the bottom. In fact, the relative industry exposures took away almost as much (the factor has no industry exposure and is therefore spared this detractor), a large cap exposure for the top versus the bottom quintile also hurt and stock-specific return took away another chunk.
Table 1 shows all factors that contributed more than 10 basis points to the difference in returns between the top and bottom quintile. In addition, it highlights some of the big net industry exposures.
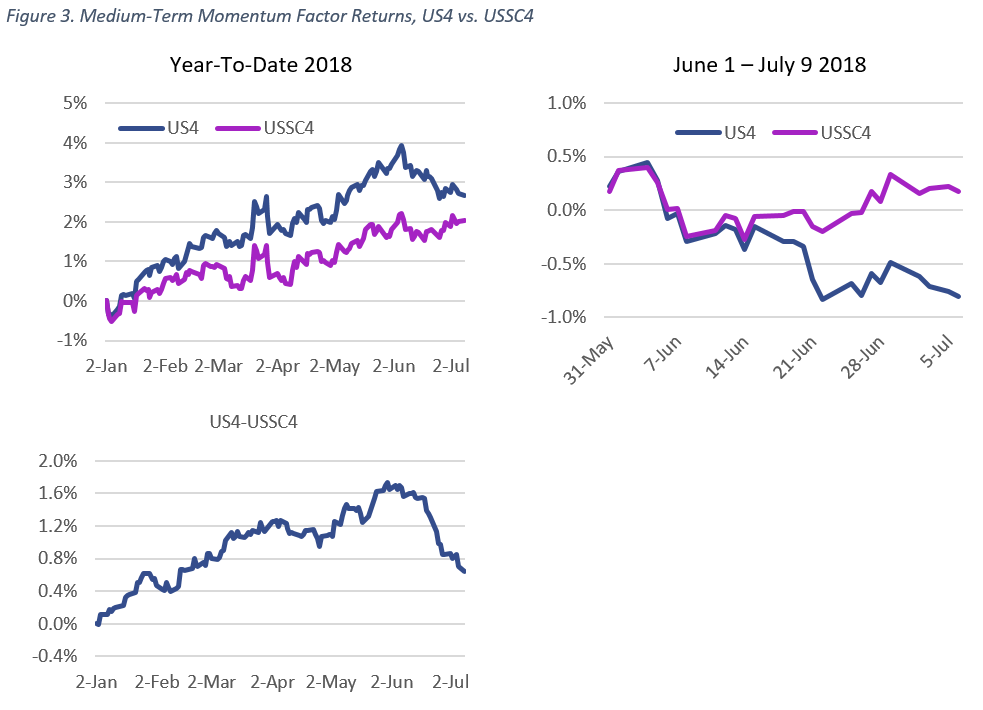
As we noted, one additional negative contributor to active performance was the relative Size exposure. The positive Momentum quintile had a slightly positive Size exposure, whereas quintile 5 had a negative exposure for a net difference of 0.26. One of the economic issues that is front and center is the potential for a nasty trade war. It seems likely that companies more exposed to trade (read: large-cap) would be hurt more by this than would smaller companies, which tend to be more domestically focused. We wondered whether small-cap stocks would therefore have been spared the rotation that was hurting Momentum in the large-cap universe, and we found that to be the case, at least as measured by the factor returns for Medium-Term Momentum in our US4 (all-cap) and USSC4 (small-cap) models. Momentum in the small-cap model was lagging its large-cap counterpart for much of the year, but their relative positions staged a sharp turnaround starting in early June.
We believe these findings have a few implications for investors:
- Quintile spreads may conflate factor performance with performance driven by other exposures. Granted, Medium-Term Momentum has had a tough go of late, but Size and Industry exposures together actually detracted more from the quintile spread than did Momentum. An investor using this factor may have chosen to reduce the exposure, when cutting exposures to Size and Industry may have actually been more fruitful. (Of course, it isn’t clear whether this will continue to be the case).
- A small-cap manager who tilts on Momentum but uses the US4 model for attribution may have found that Momentum’s contribution to active return was inflated early in the year (with the difference likely going into specific, or unexplained return), whereas more recently the return may have been understated (and specific return overstated). In neither case does the manager get the “credit” he or she deserves for factor bets.
- Momentum returns have been disappointing, but not horrible, and the damage may already have been done. The downturn has been going on for more than a month, meaning that stocks that have fared well recently will start to become the stocks with the better momentum going forward.
[1] According to the US4 model.
[2] Using expected daily volatility based on our US4 short-horizon fundamental model at t-1 as the denominator on day t.
[3] The returns are weighted by market capitalization.


