

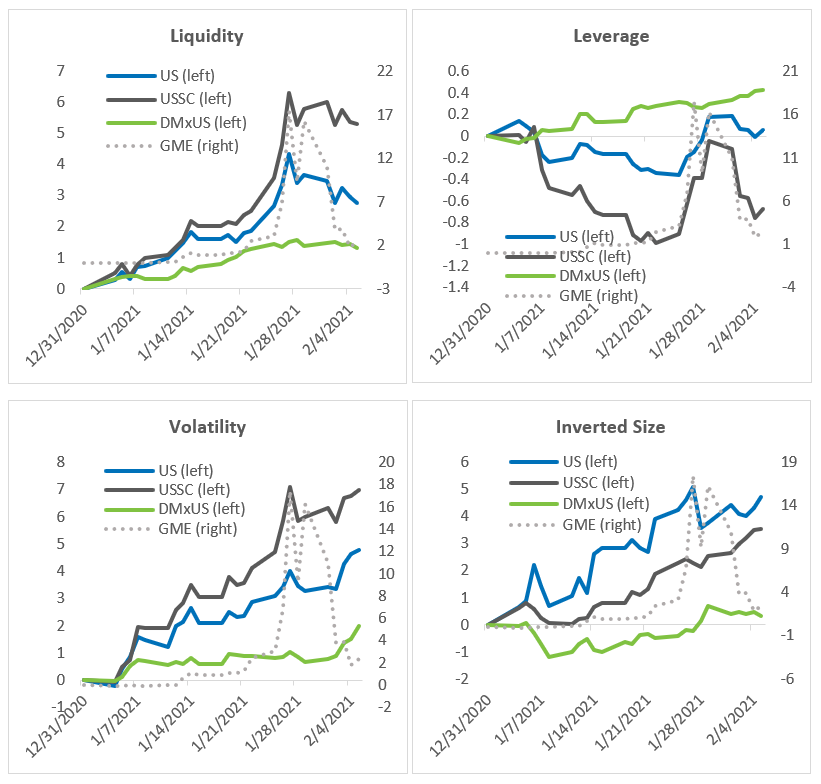
The impact of Robinhood et al. did not escape the attention of our risk models. The roles of Liquidity and Leverage as risk factors in the Axioma fundamental models has been in full display on the heels of the recent trading frenzy which sent previously unpopular stocks soaring in January, only to tumble in early February. Other typically “compensated” style factors, such as Volatility and Size, also had a significant reaction, resulting in an overall increase in style factor risk.
Compensated and uncompensated style factors react to trading frenzy
As trading triggered by the GameStop (GME) phenomenon surged, highly liquid and leveraged stocks strongly outperformed in the US in January. Liquidity saw an outsized return for the month in both Axioma’s United States Small Cap (USSC) and All Cap (US) medium-term fundamental models. Most of the names in the recent Robinhood-related news are, of course, smaller cap. And while they likely had a much bigger impact in the small-cap world, their impact in the all-cap model was non-negligible.
The difference in Liquidity’s performance in the US vs. Developed Markets ex-US (DMxUS) was striking, with the latter seeing just a quarter or a half, respectively, of the USSC and US Liquidity monthly return. Liquidity’s return was slightly negative in February, following the reversal in prices of the previously popular GameStop-like stocks.
The performance of Leverage, Volatility and Size in Developed Markets ex-US was also more subdued, compared with the US over the same period, as shown in the charts below.
After dipping to a year-to-date low around Jan. 20, Leverage rebounded sharply and ended January with a small positive return in the US model. US Leverage fell slightly in February, but its year-to-date return remained positive by Feb. 5. In contrast, USSC Leverage covered most losses suffered earlier in the month in the second half of January, only to fall abruptly again in February. USSC Leverage’s cumulative year-to-date return never made it above the red line and dropped even further by Feb. 5.
We also saw large swings in other typically compensated style factors, such as Volatility and Size. Volatility rose considerably, while Size took a dive; that is, higher volatility and smaller capitalization stocks outpaced their lower-volatility, larger-cap counterparts. Volatility’s return ran counter to long-term expectations, whereas the negative return to Size was in line with its long-term average return.
Volatility retraced some of its steps in the last days of January, but in February seemed undeterred by the tumbling of a handful of stocks popularized by retail investing, as the style factor climbed to new highs.
USSC Size continued to fall while US Size, after sagging a bit as GME nosedived, ticked up again in the first week of February when the US market rallied, encouraged by the rollout of vaccines, a decrease in jobless claims and the prospect of more fiscal spending.
Note that on the charts below, style factor cumulative return is shown against the left axis and GameStop’s cumulative return is shown against the right axis. The chart for Size presents an inverted cumulative factor return in order to better align with the GameStop rise, which triggered the craze in retail trading and the corresponding outperformance of smaller shares.
Liquidity and Volatility record outsized returns in January
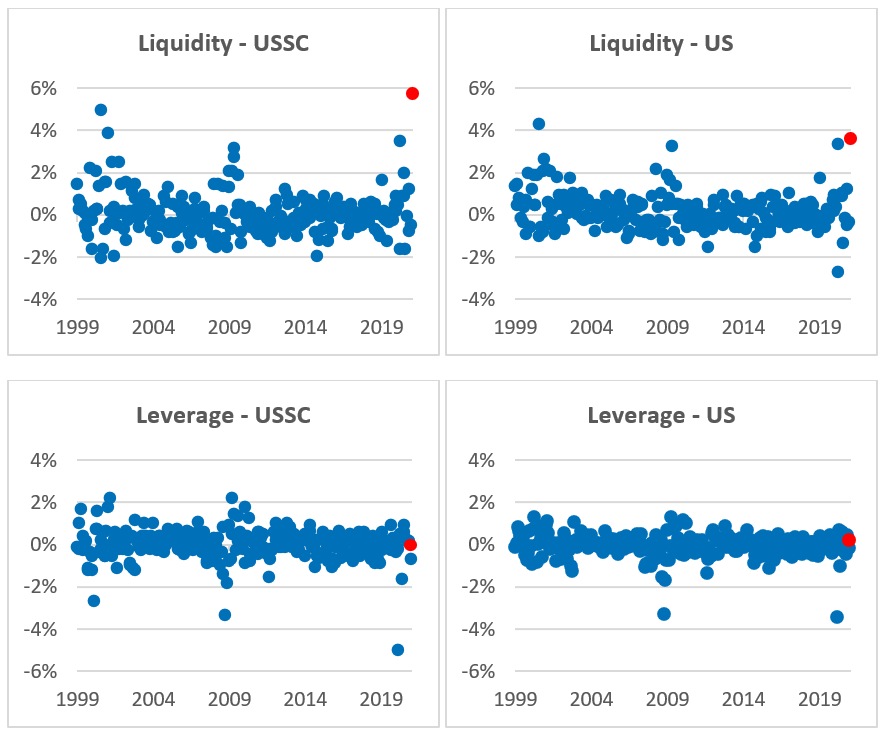
Leverage and Liquidity are generally considered pure risk factors because they do not offer high magnitude or consistent returns over the long term. However, they can clearly generate big returns in a given period, as demonstrated by their behavior in January. Such unusually high returns can have a large and unexpected impact on portfolio active returns.
Monthly returns[1] for Leverage and Liquidity generally fell within a range of -2% and +2% in both US models over the past two decades. In January, however, Liquidity was up 6% in the USSC model, more than seven standard deviations away from the 21-year average. This is the highest monthly return we’ve seen in the USSC model since at least 1999.
In the US model, Liquidity’s 4% January return was four standard deviations away from the long-term average. This is the second-highest monthly return in the US model in the last 20 years.
Even a small negative exposure to Liquidity in January could have cost managers considerably in active return.
Leverage’s January return was in line with its historical average in both US models, but that does not consider the intra-month large swings, which were captured by the increase in risk for the factor.
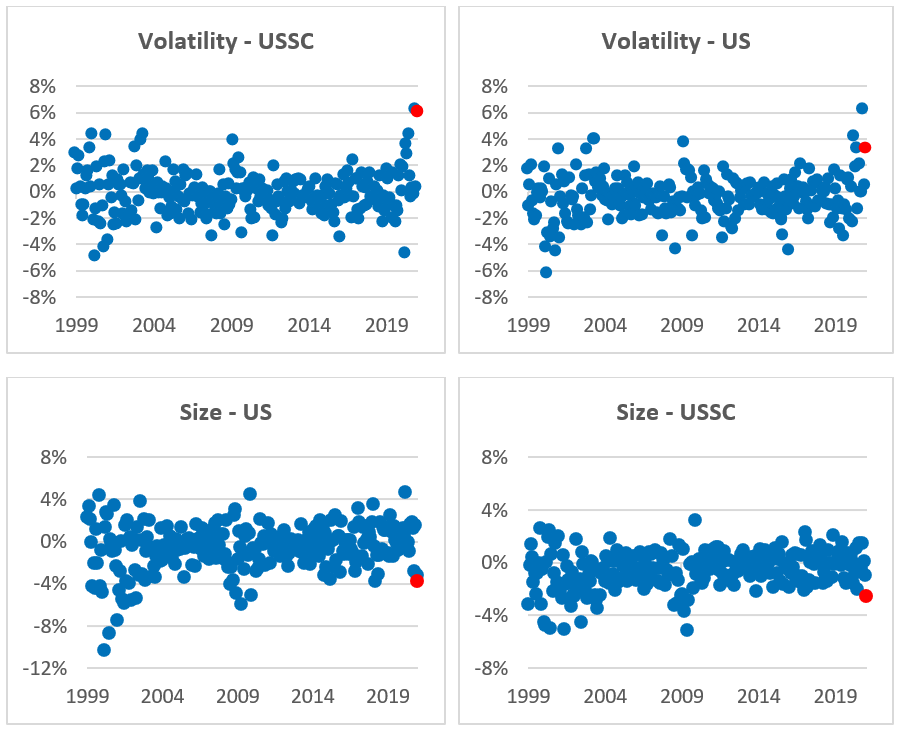
Performance of the Volatility factor is on average negative, meaning that lower volatility stocks generally outperform their higher volatility counterparts, but January’s factor return in both US models was strongly positive, though only in the USSC model did Volatility post an outsized[2] return in January.
The outperformance of smaller capitalization stocks thus far in 2021 has been in line with the long-term trend of the Size factor, which typically sees negative monthly returns.
The charts below show monthly returns since 1999; the red dots represent January 2021 returns.
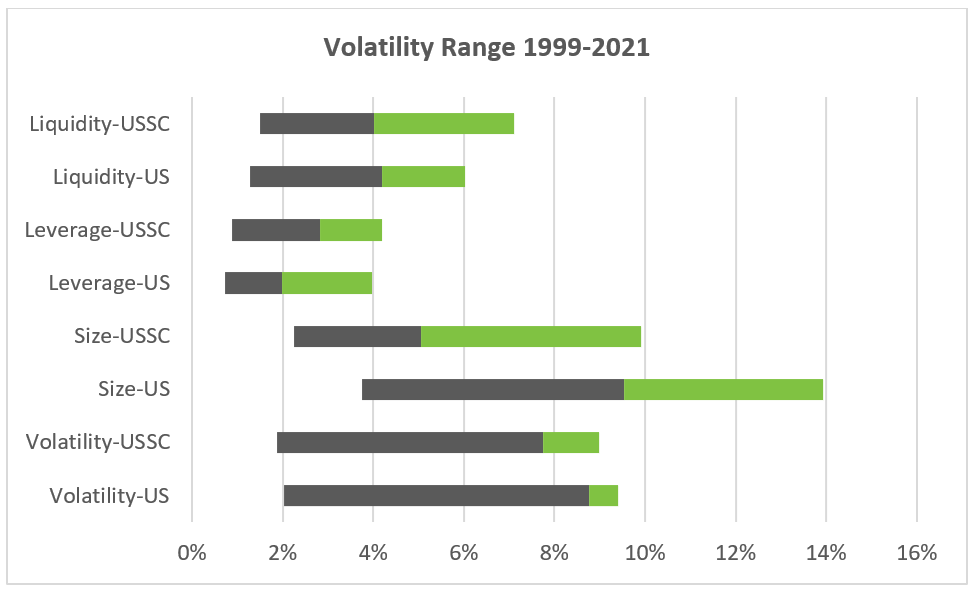
Large magnitude returns drive Volatility’s risk toward historical highs
Liquidity, Leverage, Size and Volatility have recorded among the largest increases in volatility in 2021, compared with their peers in each of the US models. Liquidity’s risk surpassed the highs observed around the market downturn last year and is now at levels not seen since 2009 for both US models. However, even with this year’s increase, USSC Liquidity’s current level of risk (where the gray bar meets the green bar in the chart below) is somewhere in the middle of its 30-year volatility range for both models. US Liquidity does fall in the top block of the volatility range, but not far from the middle.
Leverage has an even tighter volatility range than Liquidity, and it is also positioned not far from the middle of its ranges for both US and USSC models.
Size is currently the riskiest factor in the US model and is positioned closer to the high end of its volatility range. In contrast, USSC Size is closer to the low end of its range.
And finally, Volatility’s risk remained close to historic levels and was pushed nearer to the high end of its volatility range in both US models.
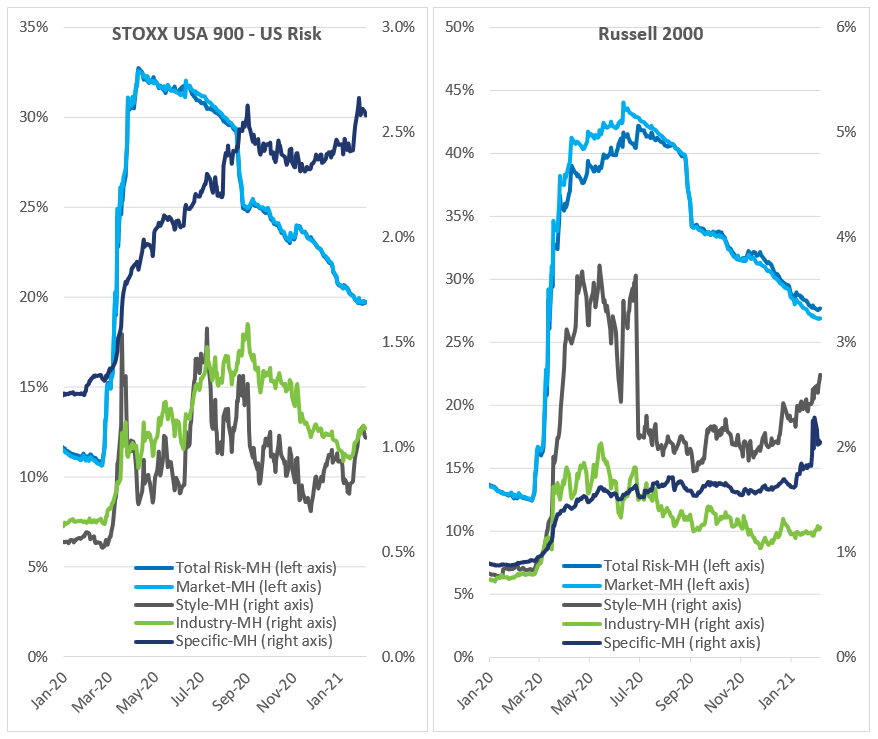
Benchmark risk continues to fall as style factor risk climbs
Total benchmark risk has drifted down for the STOXX USA 900 year to date, led down by market risk, even as industry, style and specific risk climbed for most of 2021, as measured by the US model. We saw a similar picture for the Russell 2000, except that here industry risk has remained relatively flat in 2021, as measured by the USSC model. Specific risk fell slightly in both models since the hyped-up stocks started to slide in late January. For more details on the rise of specific risk in the Russell 2000 in January, please see the blog GameStop exposes the game: specific risk skyrockets amid trading frenzy.
In conclusion, two pure risk factors—Leverage and Liquidity—and two other typical compensated factors—Size and Volatility—saw unexpectedly large returns in January. And even if they did not have much of an effect on total benchmark risk, active risk was likely to have been impacted much more by these increases in factor volatility.
We would expect the magnitude of the returns for Liquidity and Leverage to settle down as the hype around GME and its cohorts fades. Assuming markets settle down, Volatility may also revert to its long-term average return, which is negative. Size has been behaving as expected, and therefore is more likely to continue on its current trajectory.
[1] Factor return refers to the return of a long-short portfolio with unit exposure to the factor in question, and no exposure to any other risk-model factor, such as other style factors or industries, etc. The portfolio may be referred to as a “factor-mimicking portfolio” because it represents the purest return to the factor.
[2] An outsized return is more than two standard deviations away from the long-term average.


