

The EURO STOXX 50® ESG Index is a version of the flagship EURO STOXX 50® benchmark that observes sustainability principles, combining exclusionary screens and integrating companies’ environmental, social and governance (ESG) scores into the stock selection.
Since its introduction in April 2019, this blog has reported on studies that reviewed the methodology and performance of the ESG index. A new whitepaper1 from Anand Venkataraman and Ladi Williams at Qontigo’s Index Product Management team now turns the focus to the liquidity and tradability of the index vis-à-vis its benchmark.
The cost and speed of trading the EURO STOXX 50 ESG portfolio are characteristics that may be of interest to investors given its specific composition methodology and the increasing demand for sustainability strategies. Because the EURO STOXX 50 ESG replaces components in the benchmark — which is made up of supersector leaders — with smaller securities, it is fair to assume in principle that the replacements are likely to be less liquid and less tradable. The whitepaper aims at estimating the extent of the differences.
The analysis is also timely as futures and options on the index were listed on Eurex last month, providing investors a key tool to efficiently and economically hedge and manage flows in sustainable portfolios.
Slightly lower capacity
The latest study starts by looking at the ESG portfolio’s trading capacity, defined as the maximum amount of equity that may be fully exited over five trading days considering the holdings and exposures at each quarterly index review.2 It then compares the estimated capacity of the index as a proportion of the estimated capacity of the benchmark each quarter.
The results show that since April 2019, the ex-post capacity of the ESG index was on average 9.7% lower than that of the benchmark, the authors write.
Trading days
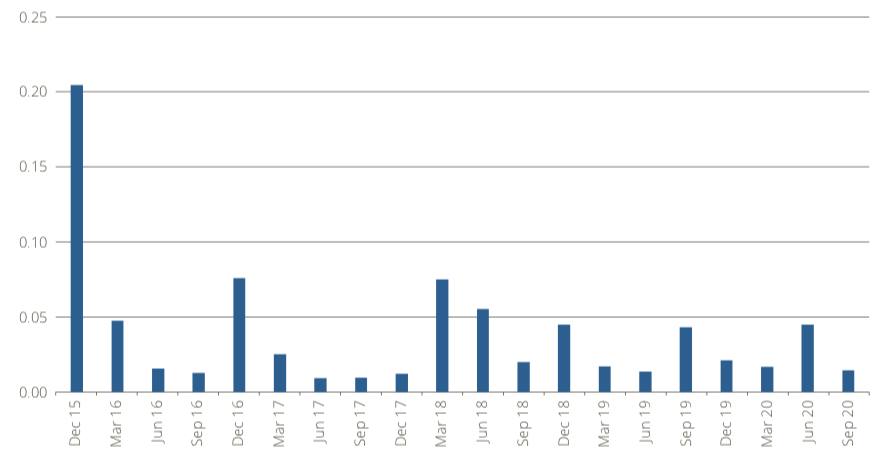
The report then turns to measure the consequence of having lower trading capacity, by calculating how many days it would take to trade the portfolio. Considering a EURO STOXX 50 ESG portfolio worth EUR 1 billion, it would have taken over the past five years an average of 0.0389 days longer than the benchmark to trade the portfolio (Figure 1), the study finds.3 Larger portfolios would lead to longer trading periods.
“This increase in the time taken to trade is unlikely to be a huge concern in the case of portfolio sizes of similar order of magnitude,” the authors write.
Figure 1 – Increase in estimated trading days for the index over the benchmark
Higher turnover
Because the EURO STOXX 50 ESG Index is reviewed and rebalanced every quarter, as opposed to annually as is the benchmark, the former sees increased turnover as the portfolio accommodates changes in weights and constituency.
Venkataraman and Williams estimate that the rolling 12-month turnover for the ESG index, in data going back to 2015, hovers between 6.5% and 25% above that of the benchmark.
This, of course, raises the cost of replicating the index versus the benchmark. The authors therefore take to estimate the cost of switching out of the benchmark and into the ESG index at each quarterly review, expressing it as a percentage of the portfolio’s value.4 Since launch the cost has remained well below 1 basis point (bp) on all occasions but one (Figure 2).
Figure 2 – Estimated cost of switching to ESG portfolio
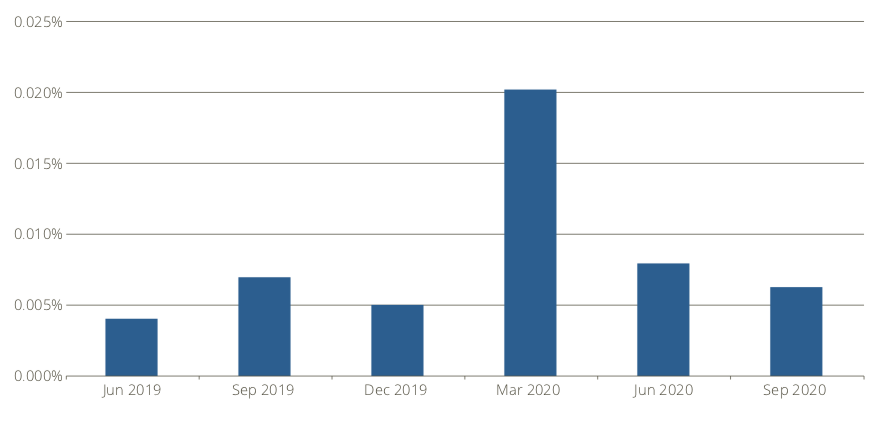
The report adds that the ongoing ESG index replication cost estimates were higher than the benchmark by a maximum of around 1 basis points over the last five years.
Conclusion
The findings suggest that while there are liquidity and tradability considerations to be had when switching from the benchmark EURO STOXX 50 Index to its ESG iteration, in most instances these don’t represent a material impact to returns. Moreover, the strong outperformance of the ESG index this year5 — while not a natural feature of the ESG index’s design and goals — has more than offset the additional trading costs it carries.
With responsible mandates growing unabatedly and new derivatives available to hedge and manage sustainable portfolios, this latest study may help investors gauge the benefits and cost of changing their portfolios. We invite you to download the whitepaper here and explore all its findings in more detail.
1 Venkataraman, A., Williams, L., ‘EURO STOXX 50® ESG: Liquidity and Tradability Characteristics,’ Qontigo, Dec. 2020.
2 The analysis is based on 50% of the three-month average daily traded value (ADTV) of the constituent security with the lowest ADTV-to-weight ratio.
3,4 Again, the portfolio consists of exactly the same holdings and exposures as the EURO STOXX 50 ESG Index at each quarterly index review (March, June, September and December).
5 Through Oct. 30, 2020, the EURO STOXX 50 ESG Index has returned 3.3 percentage points more than its benchmark this year, measured as gross returns in euros.


