

Climate-related strategies dominate flows into ETFs classified as ESG, with little to no money going to funds that target principally social and governance issues, according to data from Qontigo.
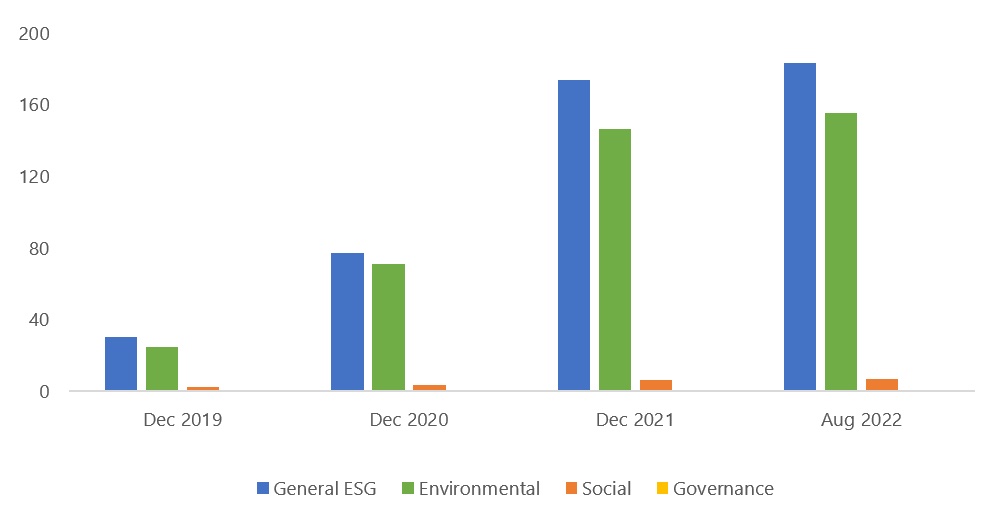
A net 40 billion euros (39 billion US dollars) flowed into passive ESG ETFs in 2022 through August, the data shows. Just over half (53%) of the capital went to general ESG funds. When looking at the other three categories — individual E, S and G strategies — 44% of the overall money flowed into environmental strategies, while only 2.8% went to social-focused funds. Net flows into ETFs with a governance remit were flat.
As of August, 346 billion euros were invested in passive ESG ETFs globally. Fifty-three percent of that total was in General ESG funds, 45% in environmental ETFs, 1.9% in social funds and less than 1% in governance products (Exhibit 1).
Exhibit 1 – Passive ESG ETFs’ assets under management (AUM) in EUR billions
The uneven flows reflect the momentum and priority that the climate and environment have gained in recent years within the investment community, but is also testament to issues around social and governance sustainability data, according to Axel Lomholt, Chief Product Officer at Qontigo.
“While it may be no surprise that climate concerns are at the front of responsible investors’ and regulators’ minds, we should take note of how little at all is being earmarked for other key areas beyond environmental,” said Lomholt.
“There are, however, reasons to be hopeful: more impact funds are coming to the market and innovative social and governance metrics based on parameters such as the United Nations’ Sustainable Development Goals (SDGs) are now accessible to investors. Clearly more work on data disclosure and standardization is needed to add steam to those segments.”
Sign up to receive valuable insights, news, and invitations as soon as they are published.
Subscribe >ESG as part of the total
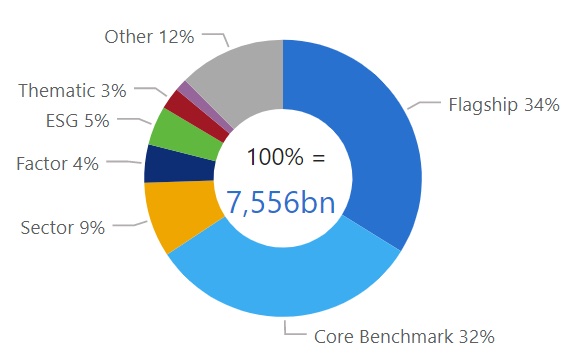
Following years of growth, the ESG segment within passive ETFs now represents 5% of the total, Qontigo data shows (Exhibit 2). In 2018, it accounted for just 0.6%. Funds that track traditional Flagship1 or Core Benchmark2 indices now take up two-thirds of the total, down from 71% in 2018.
Exhibit 2 – Market share of all passive ETFs by segment in EUR billions
New funds
Among 473 passive ETFs launched around the world in 2022, 100 belong to the ESG segment, the highest tally among eight categories. Thematics followed with 92 launches and Core Benchmark came up third with 71 new funds.
Geographic segmentation
Of the 40 billion euros invested in ESG ETFs in 2022, 30 billion, or 75%, went to funds based in EMEA, a region that accounts for nearly two-thirds of all passive ESG ETF assets in the world. That equaled to 14.5% of total ESG ETF assets in EMEA at the end of 2021. ESG ETFs based in the Americas recorded net inflows of 5.6 billion euros this year, or 5.4% of existing assets at the end of last year. Meanwhile, Asia/Pacific had 4.4 billion euros in net flows in the segment, or 26.4% of ESG ETF assets in the region at the end of 2021.
The full picture
So far in 2022, passive ETFs have lured a net 339 billion euros worldwide, or 4.4% of total assets at the end of 2021, even as equity and fixed-income markets tumbled amid rising interest rates. That compares with net withdrawals of 677 billion euros from active mutual funds, according to Qontigo data.
The total AUM invested in all passive ETFs has dropped 1.5% to 7.6 trillion euros, from 7.7 trillion at the end of 2021, driven by negative investment returns.
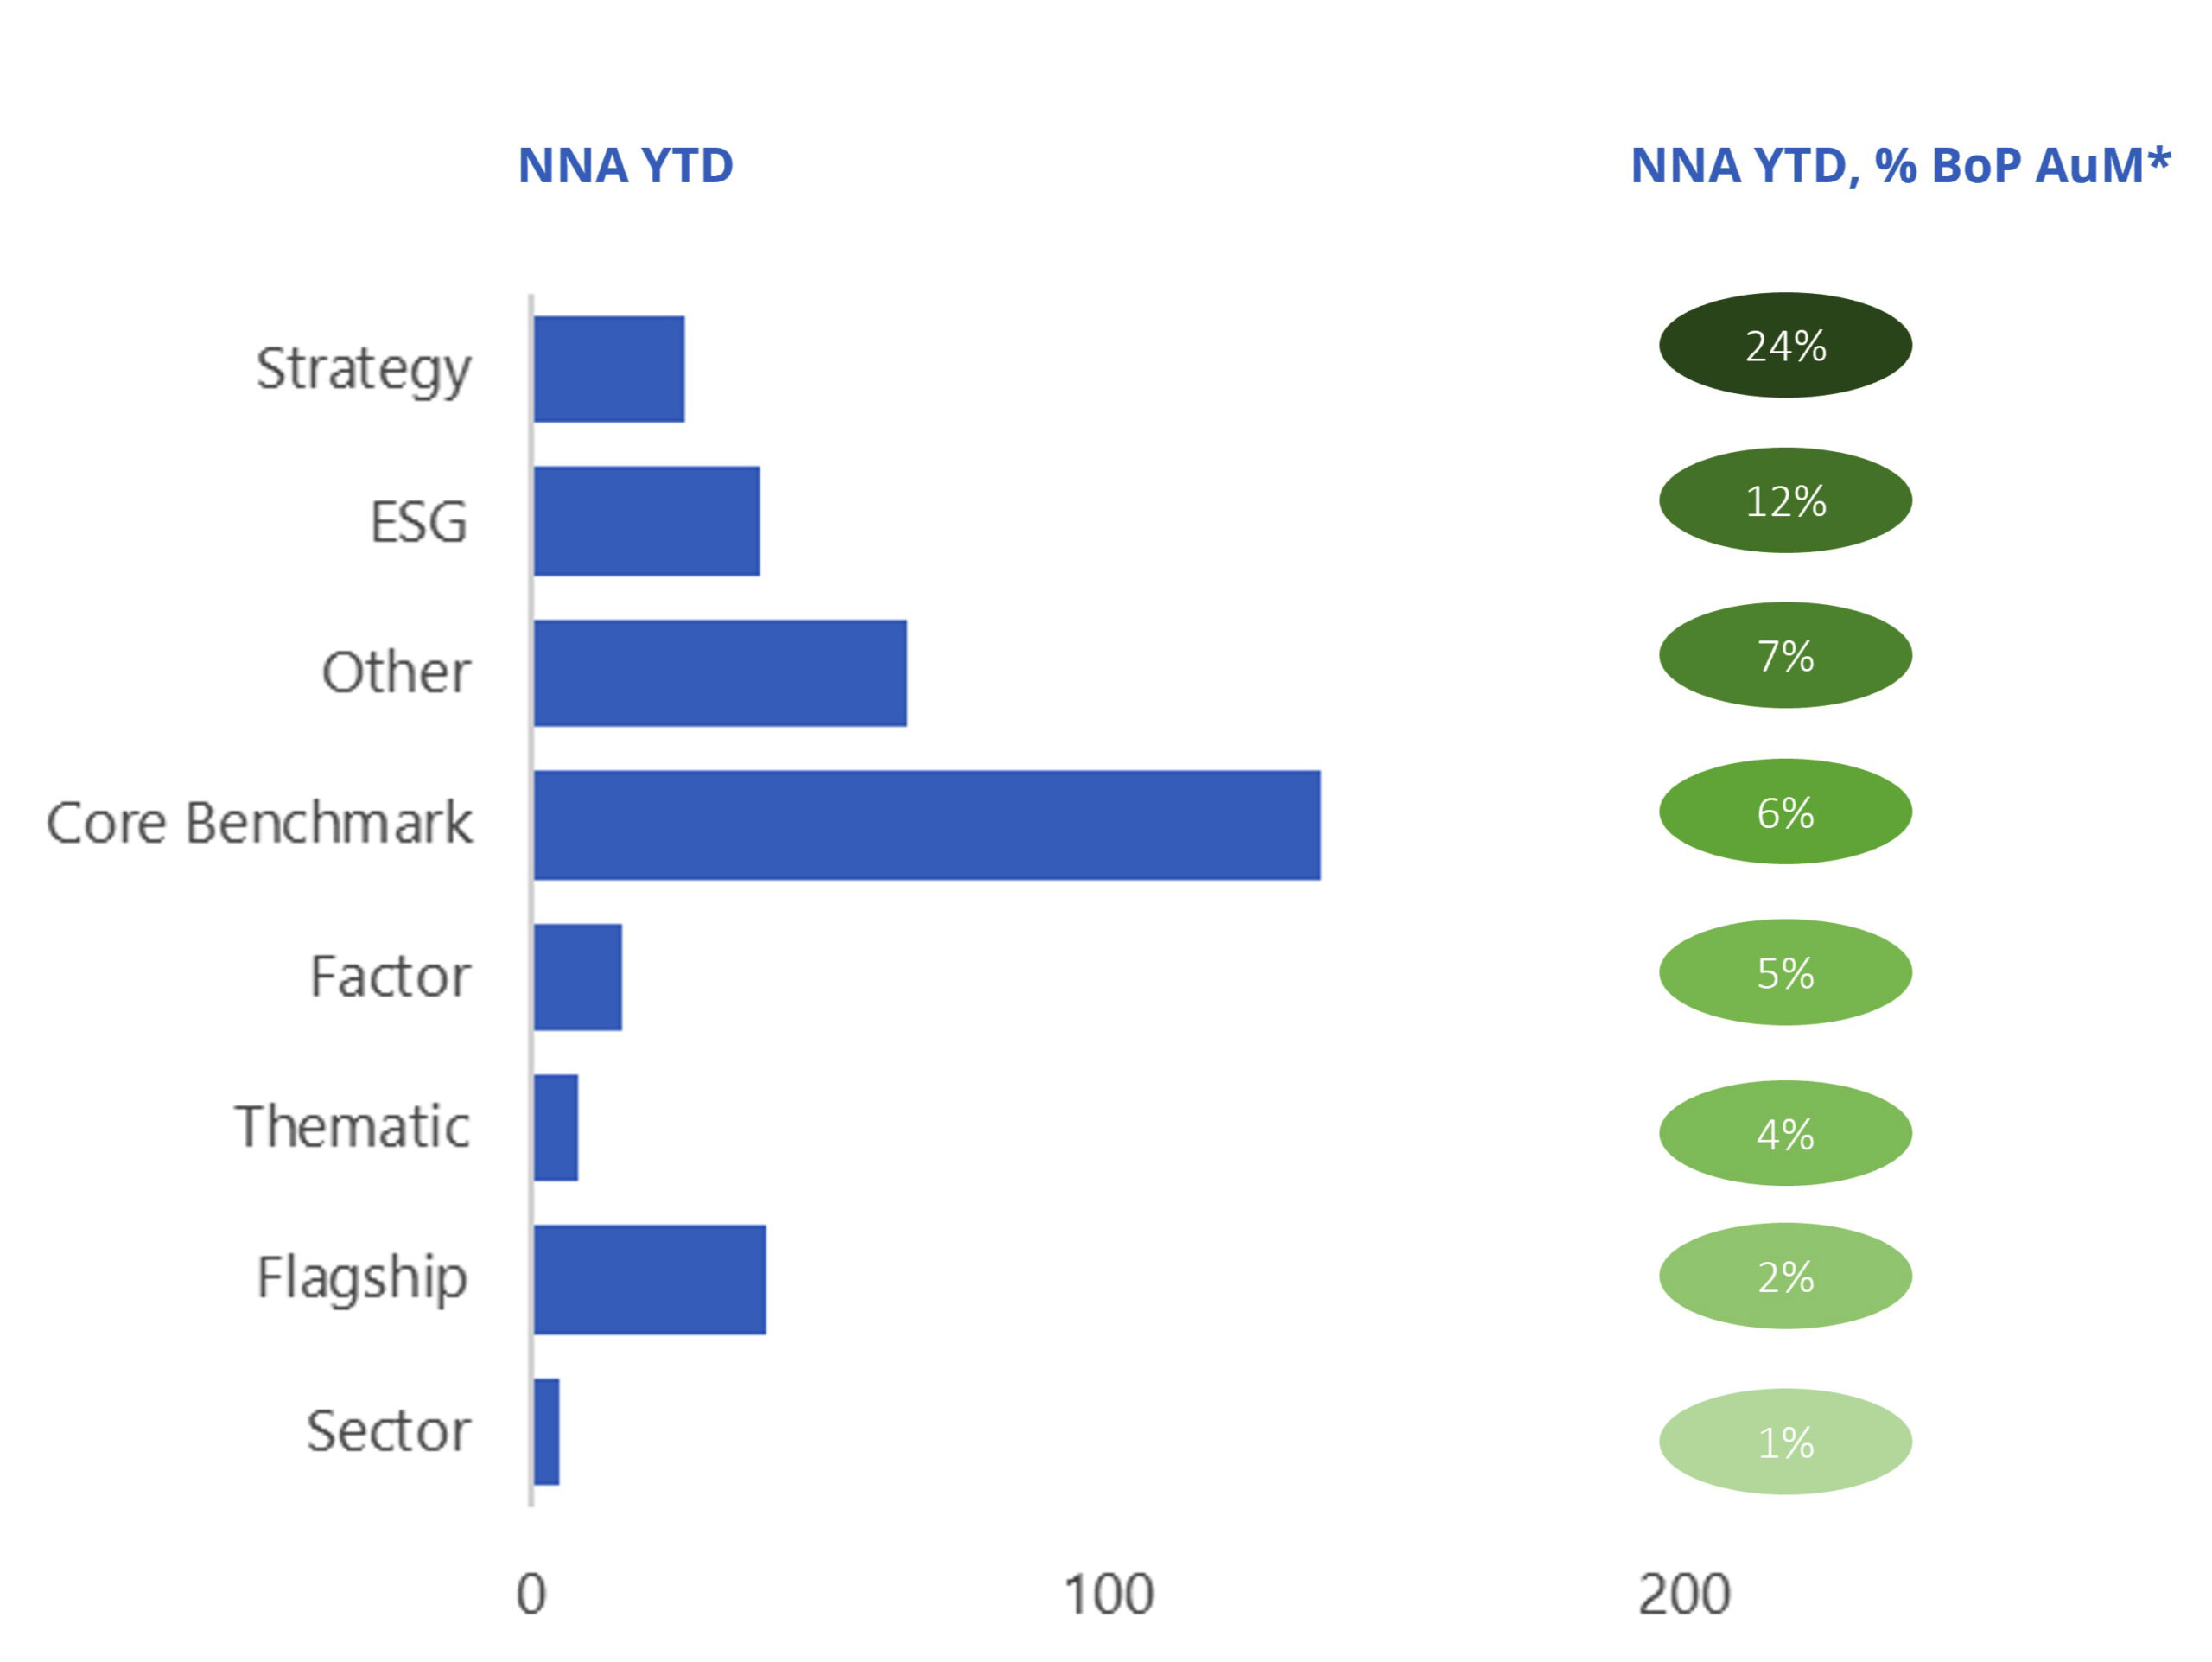
Within passive ETFs, ESG ranks No.2 in 2022 by net inflows as percentage of total assets (Exhibit 3). The segment is trailing the Strategy category, which includes volatility funds and inverse and leveraged products. Strategy funds have received net inflows in 2022 to the tune of 24% of assets under management.
Exhibit 3 – Passive ETF net inflows in 2022 expressed in EUR billions and as % of assets at beginning of period (BoP)
SFDR Arts. 8 and 9
Diving deeper into Europe’s Sustainable Finance Disclosure Regulation (SFDR) article classifications, EMEA-based ‘deep green’ Article 9 ETFs have recorded 11 billion euros in net capital in 2022, or 35% of existing assets at the end of 2021. ‘Light green’ Art. 8 ETFs have received 17 billion euros, or 12% of assets, while funds marketed as ESG but falling under Art. 6 (not aligned with SFDR’s sustainability goals) have attracted 1.6 billion euros, or 6.3% of assets. About 2% of total ESG passive ETF assets in EMEA still don’t comply with either Art. 8 or 9 of the European legislation, the data shows.
Part of the AUM growth in the Arts. 8 and 9 categories may stem from managers’ switching fund strategies. EMEA asset managers continue to re-purpose funds as regulation moves ahead with stricter requirements around responsible investing. Starting Aug. 2, 2022, Europe’s amended MiFID II requires financial advisers to also consider clients’ sustainability preferences as part of their suitability assessment. This has led to a tide of new and re-labeled ‘green’ funds that are compliant with SFDR rules.
Qontigo’s Market Intelligence Team analyzes ETFs’ data, their prospectus and benchmarks to classify them as either having an Environmental, Social, Governance or General ESG remit. Factsheet information can complement the analysis. For more information contact Tomas Frabasile, Senior Director, Strategic Analysis and Intelligence, at tomas.frabasile@qontigo.com.
1 Flagship indices include the main, most liquid indices provided by large index companies.
2 Core Benchmark includes country and size indices not part of the Flagship category.


