
Top Takeaways:
- Energy stocks soared in Q1, and their index representation increased. At the same time, Energy’s contribution to US benchmark risk fell, and is now lower than what would be implied by the weight. At the same time, Technology’s weight fell, and Consumer Discretionary’s risk contribution rose.
- Most macro factors in the model produced positive returns, with inflation-related factors having among their highest quarterly returns since the model’s inception. Still, many exposures trended toward zero during the quarter, so despite the high returns they had little impact on the overall market.
- Correlations increased during the quarter, driving down the diversification ratio.
- Despite the market turmoil, factor returns were largely in the expected direction and not outsized relative to risk expectations. Value and Earnings Yield had among their most positive quarters ever in many regions, whereas Growth and Market Sensitivity returns were in the bottom decile. Profitability struggled.
- Momentum and Market Sensitivity exposures became much less correlated in Q1, while Momentum and Dividend Yield became more positively correlated. The correlation between Momentum and Value and Momentum and Growth remained close to zero.
- In summary, given the market dynamics of high inflation and war, it was surprising that the risk environment did not change more.
Short-horizon predicted volatility
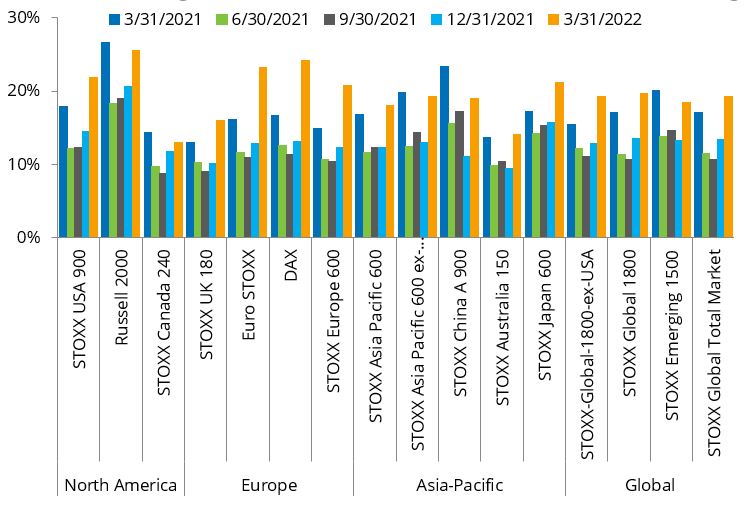
- From Q4 to Q1, risk was up between 10% (STOXX Canada 240) to almost doubling (DAX and Euro STOXX, now among the riskiest of indices). Risk was up 50% in the US, and about 45% in Global Developed Markets
- In many cases it is also higher than it was a year ago, but not in the Russell 2000, Canada 240, APxJP, China or the Emerging 1500
- The Russell 2000 is the riskiest of the indices, and US Large cap isn’t far behind. Canada remains lowest risk and surprisingly Emerging Markets risk is at the lower end
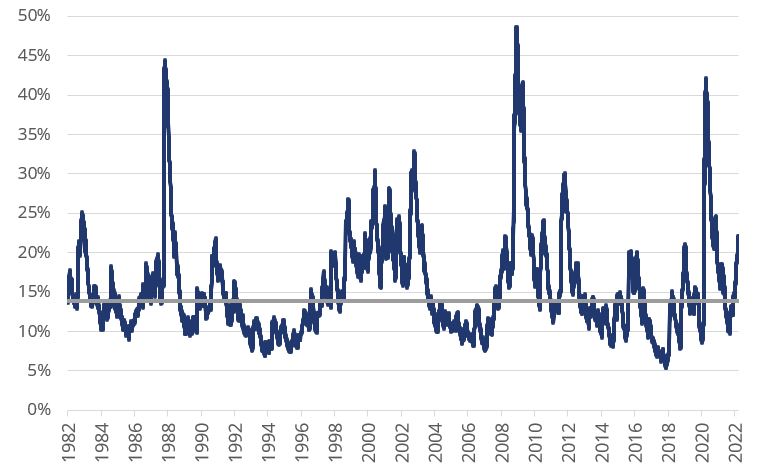
US Short-Horizon Fundamental Predicted Risk
- After ending 2021 with average risk, the US saw its short-horizon volatility shoot up and almost reach the top decile relative to its 40-year history
- With the exception of the COVID spike, it has been 10 years since volatility reached this level
- A sharp and sudden increase of short-horizon risk can be a harbinger of a market peak
Sector Weights and Risk Contribution – STOXX USA 900
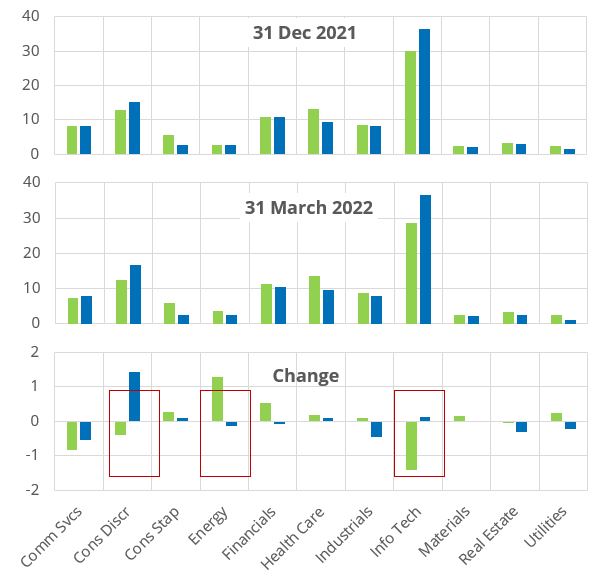
- Energy’s Q1 run increased its index weight by more than 1%, but its contribution to risk actually fell slightly
- In contrast, Info Tech’s weight fell by almost 1.5%, but its risk contribution increased a bit, and it remains by far the highest weighted and contributing a third of the benchmark risk
- Consumer Discretionary was the only sector to see a substantial increase in risk contribution
Macro Factor Returns: Many Returns Were Close to the Highest Ever
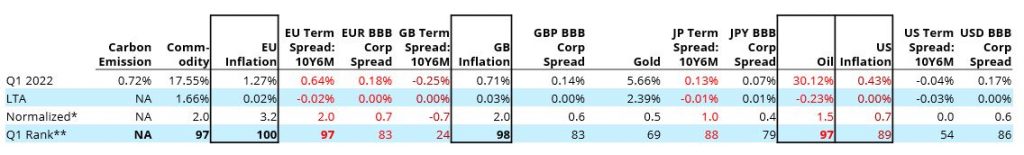
- Many macro factors’ returns were among the highest for a quarter in the history of the model, most notably the inflation, oil and commodity components
- EU inflation was more than three standard deviations above the long-term average, and GB inflation, commodities and EU term spreads were two standard deviations away from the long-term average
*Normalized: (Actual Return – Long-Term Average)/Realized Standard Deviation
**Rank: Percentile relative to long-term history. Bold means top or bottom decile
Macro Factor Returns: Many Returns Were Close to the Highest Ever
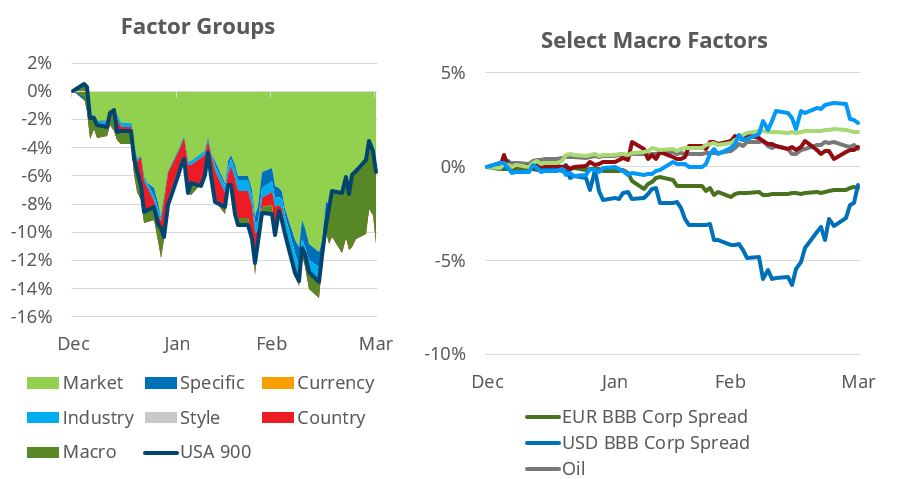
Q1 Performance Attribution: STOXX USA 900
- Despite the big and generally positive macro factor returns, they had relatively little impact on the US market in Q1, where most return could be attributed to the market factor
- The US BBB spread exposure (-) was the major macro drag on performance for most of Q1, but that reversed sharply in March. The exposure remains highly negative
- Macro factors started to contribute positively in March, essentially propelling the positive return
Despite increasing volatility, most factors’ returns were within the expected range
Q1 2022 Performance
Note: an “*” indicates that the return was two standard deviations or more away from the long-term average, with the standard deviation defined as the risk forecast at the beginning of the period. The highest and lowest regional return for each model is highlighted.
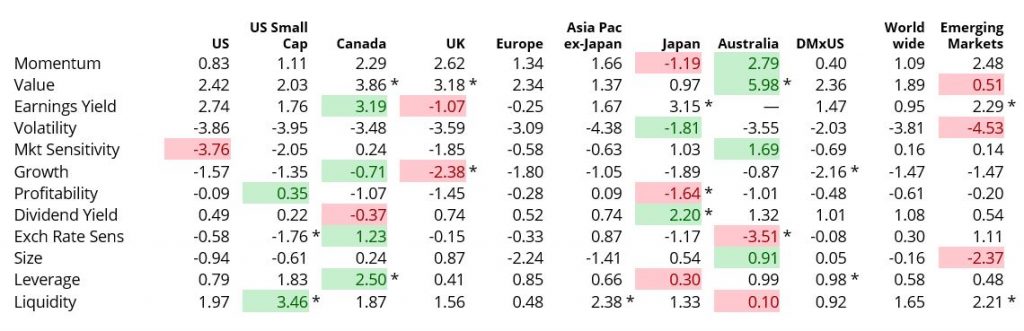
A Closer Look at US Style Returns: Many Returns Were Unusually Good or Unusually Negative
- In some regions, the return to Market Sensitivity has been so positive it has flipped the long-term average from negative to positive, and even the negative return in Q3 did not flip it back (in WW4 and APxJP4)!
*Normalized: (Actual Return – Long-Term Average)/Realized Standard Deviation
**Rank: Percentile relative to long-term history. Bold means top or bottom decile
Red denotes typically compensated factors with big returns opposite to the long-term average
US Factor Exposure Correlations
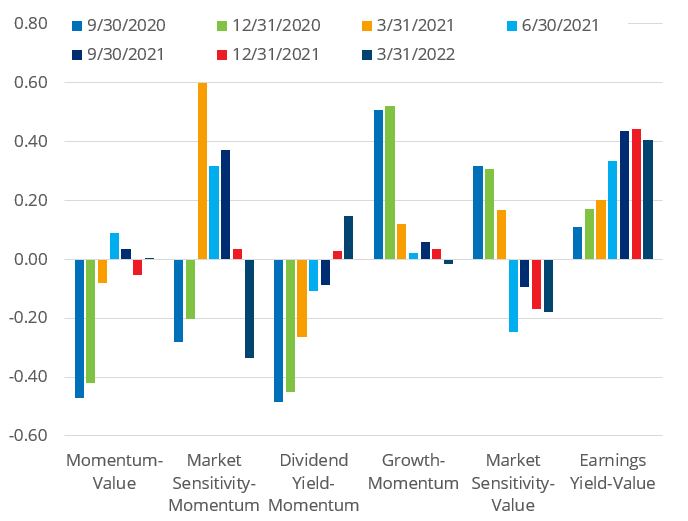
- Momentum and Value remain uncorrelated
- Momentum and Market Sensitivity are now uncorrelated, after three quarters of highly positive correlations
- The correlation between Dividend Yield and Momentum has turned positive – Dividend Yield now has some momentum
- The relationship between Market Sensitivity and Value remains negative ›Most other factor pairs’ correlations have not changed signs
For more information, view the recording of our Qontigo Insight™ Quarterly Risk Review – Q1 2022 webinar or download the presentation slides.
For questions or comments about this data, please contact the Qontigo Applied Research team.


