
Potential triggers for sentiment-driven market moves this week1:
- US: Ongoing earnings reports, consumer confidence, Fed Chair Powell’s speech.
- Europe: German inflation and industrial production data; UK Q4 GDP estimate.
- APAC: China January CPI and PPI data; Australia’s RBA interest rate decision.
- Global: Central bank speeches, forward guidance by CEOs, inflation data.
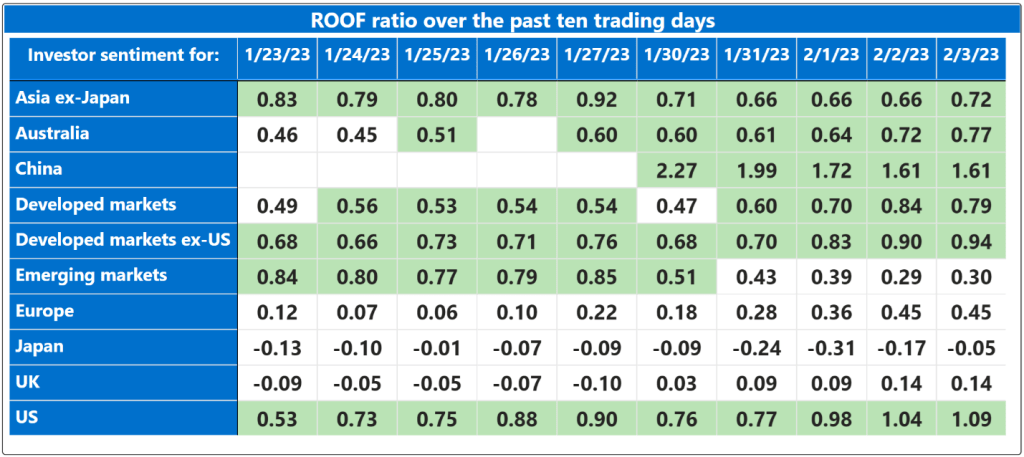
Summary of changes in investor sentiment from the previous week:
Investor sentiment ended last week either strongly positive or bullish in all markets we track except Japan and the UK, where investors have remained neutral. Globally, sentiment has been on a strong recovery path since the bearish levels of late October, when investors first reached a consensus that decades-high inflation may have peaked, leaving open only the question of whether the economy would experience a soft or a hard landing in the wake of unprecedented monetary tightening. The jury is clearly still out on that one but rising sentiment indicates a growing anticipation of a positive outcome by an increasing number of investors.
Last week’s US jobs report was a poster child for the kind of economic conundrum investors are facing. Projected layoffs from pandemic profiteers in the technology and financial sectors buried in their weak earnings guidance for 2023, contrasted with strong job gains across industries from hospitality to healthcare to retail, painting a picture of a booming economy that shouts, “Anyone who wants a job will get one – we need hundreds, can use thousands”. Conflicting reports are giving the impression that the most anticipated recession in history is nothing but a slowdown with a full employment problem. Given this mixed economic picture, the current bullish investor sentiment may simply represent the combination of what investors’ patience can endure (from the sidelines), and what speculators’ resolution can achieve (in the market).
Welcome to the irony economy, where the surface meaning and the underlying meaning of the data are not the same. Some investors are reacting to the denotation — the textbook definition — of the economic data, thinking that strong job growth means a strong economy, which is good news for risk assets. Others are reacting to the connotation — the contextual implication — of the data, thinking that a strong job growth means higher interest rates for longer, which is not good news for risk assets.
The weakness of market data-based indicators like the ROOF Scores is that their conclusions represent the votes of only those investors active in the market at the time. These are currently saying “Buy! Buy! Buy!”. But what about the absentee votes, of which the still low average daily traded volumes tell us there are plenty? We can deduce that they are not saying “Sell! Sell! Sell!”, or they would not be on the sidelines. They are saying “Interest rates were swift to rise, will be slow to peak, slower still to fall”. In that, they are echoing the voices of central bankers paraphrasing Baudelaire on the Devil by consistently reminding markets that the greatest trick inflation ever pulled was convincing investors that it didn’t exist.
Speculating and investing represent the two ends of the same spectrum. Too many speculators, and the market turns into a bubble, but a profitable one. Too many investors and the rally risks fizzling out early because some participants have a shorter risk horizon. Given the ongoing contradictions in the fundamentals — be it economic data or corporate earnings — markets and sentiment are most likely driven by an increasing willingness to speculate. If you are the kind that feels profits won are twice as sweet as profits earned, enjoy it while it lasts — the game is on. For those needing profits to be the logical reward for a well-supported investment thesis, keep your powder dry, there will be other, clearer opportunities to implement your views.
Changes to investor sentiment over the past 180 days for the markets we follow:
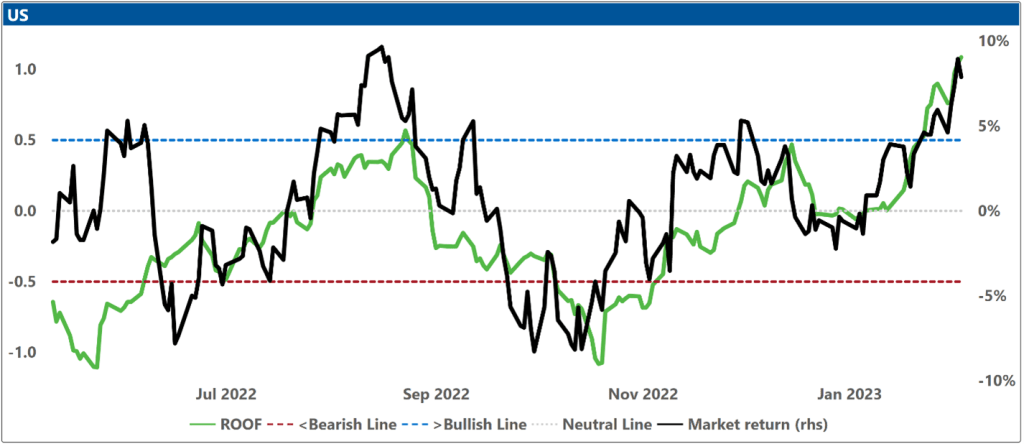
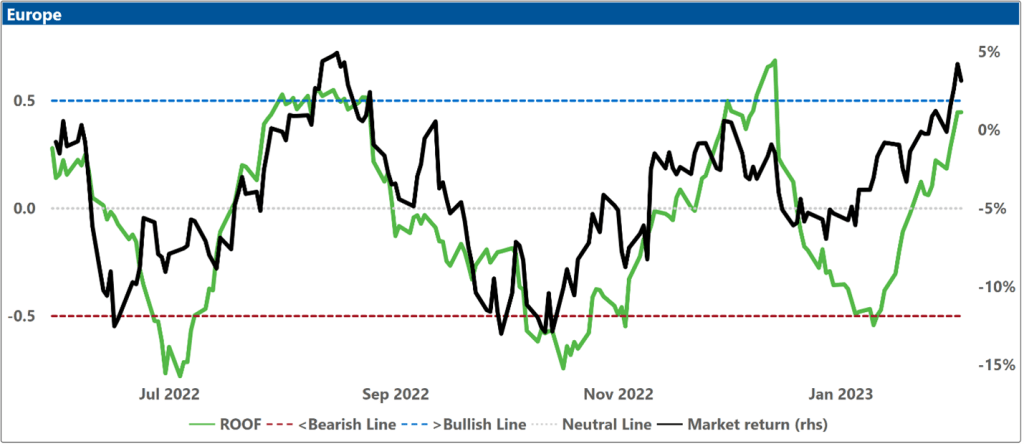
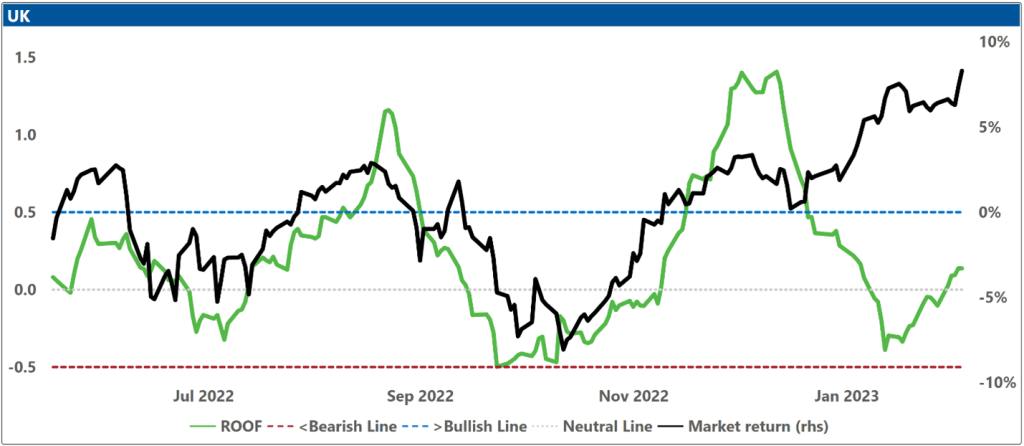
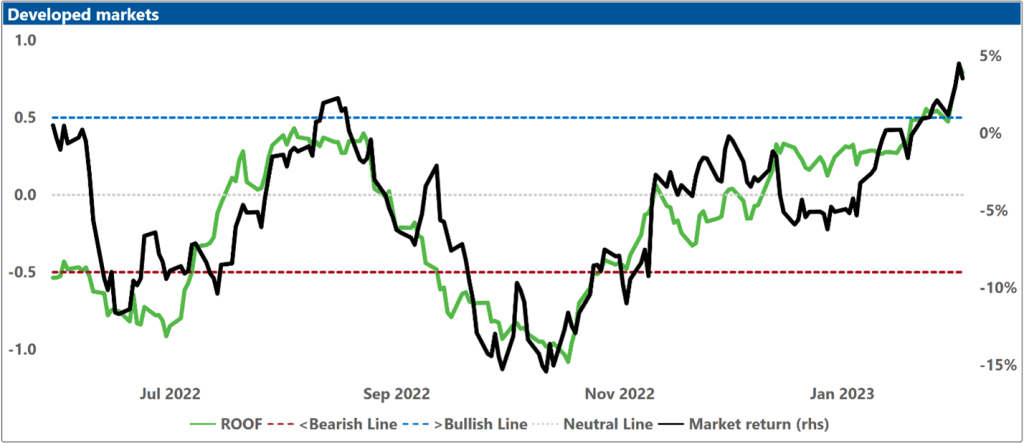
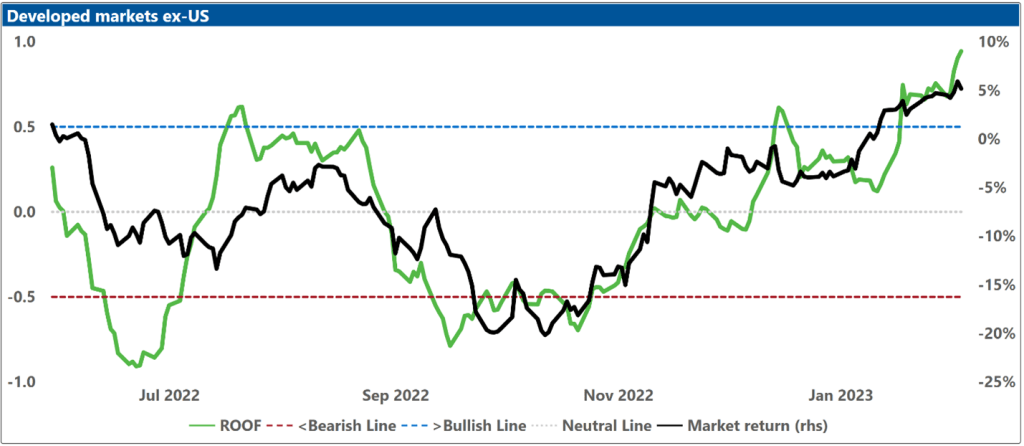
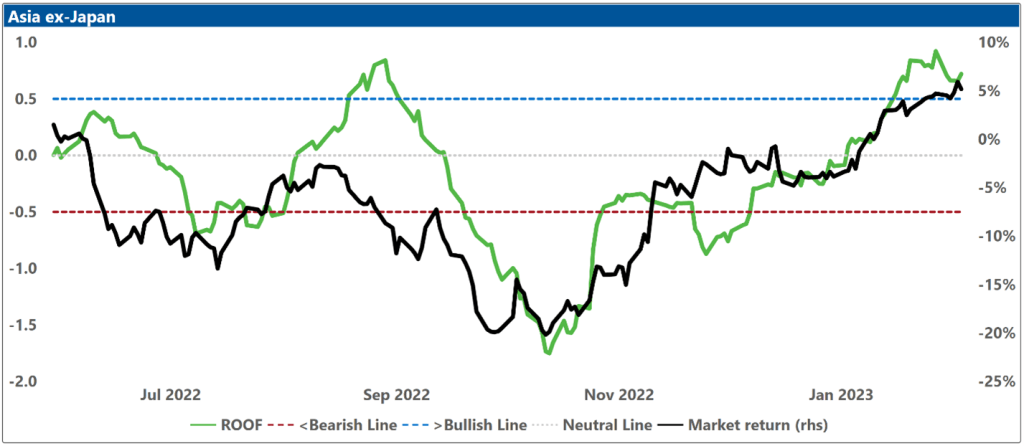
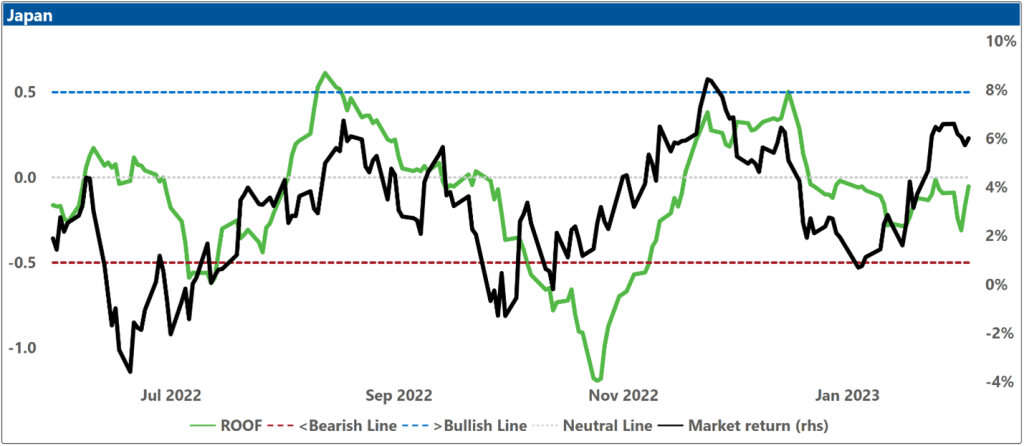
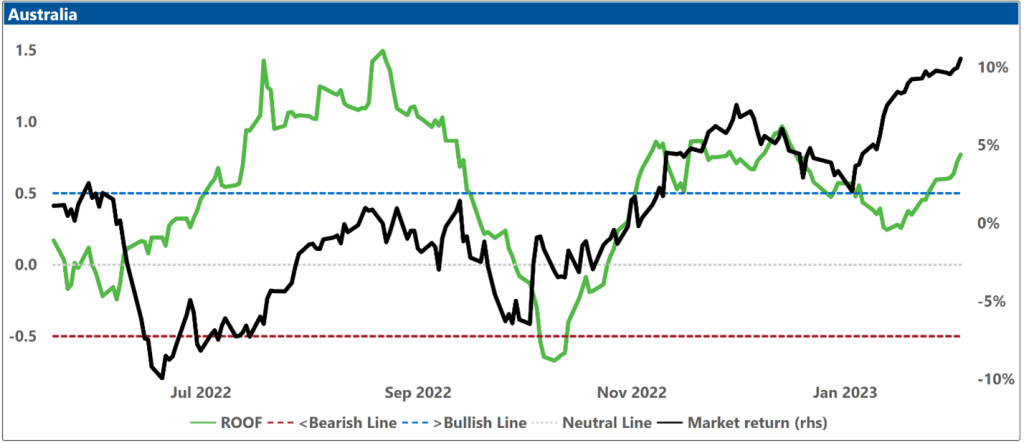
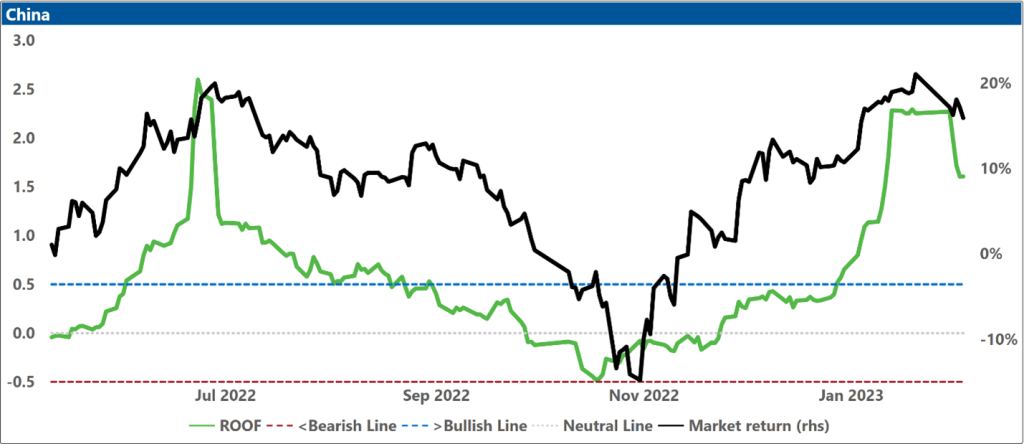
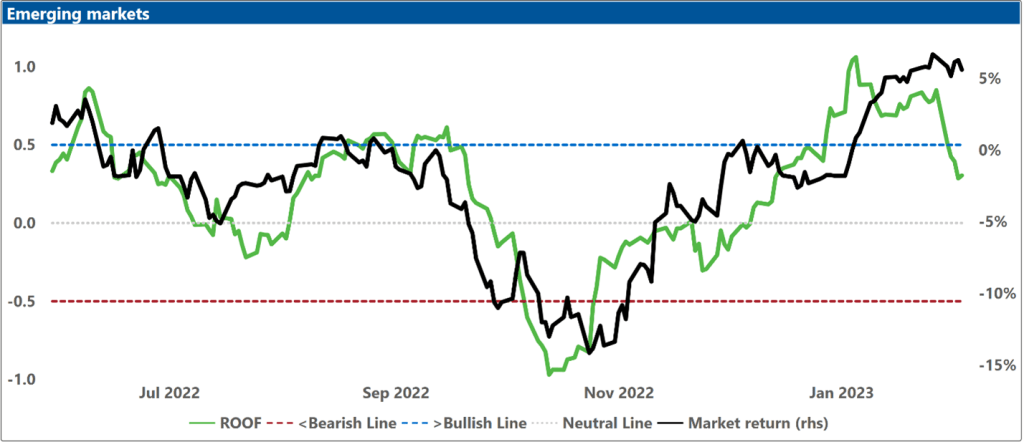
How to read these charts: The top charts show the ROOF ratio (investor sentiment) in green (left axis), against the cumulative returns of the underlying market in black (right axis). The horizontal red line at -0.5 (left axis) represents the frontier between a negative sentiment (-0.2 to -0.5) and a bearish one (<-0.5), and the horizontal blue line at +0.5 (left axis) represents the frontier between a positive sentiment (0.2 to 0.5) and a bullish one (>0.5). In between those two lines, sentiment can be considered neutral (0.2 to -0.2).
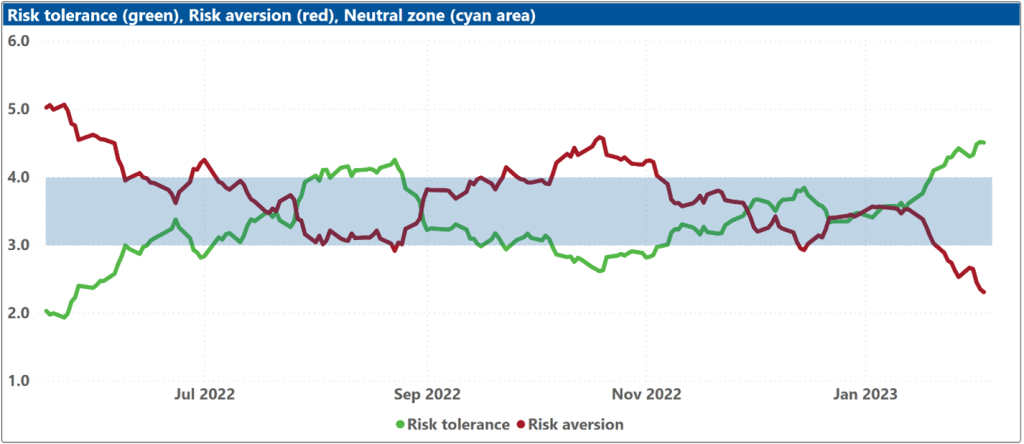
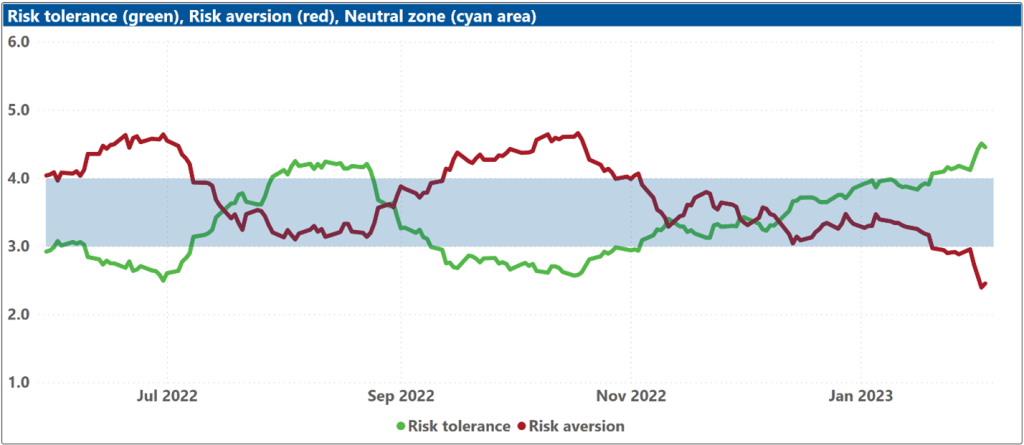
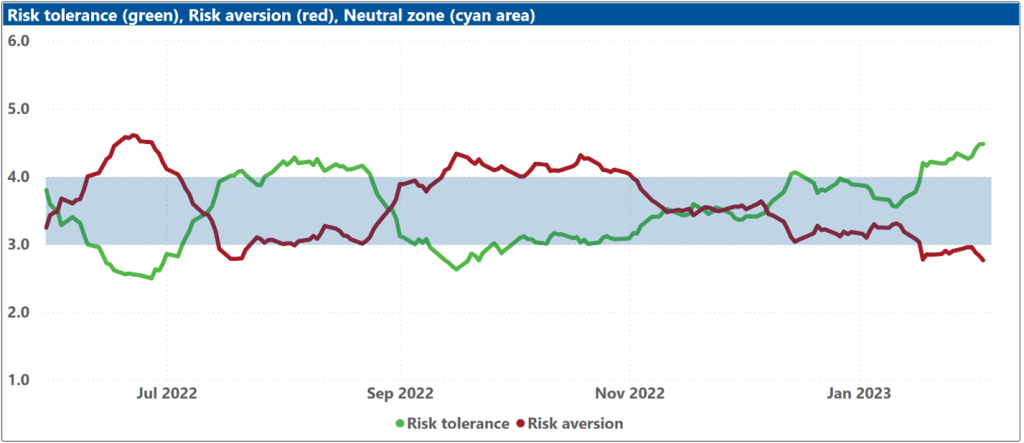
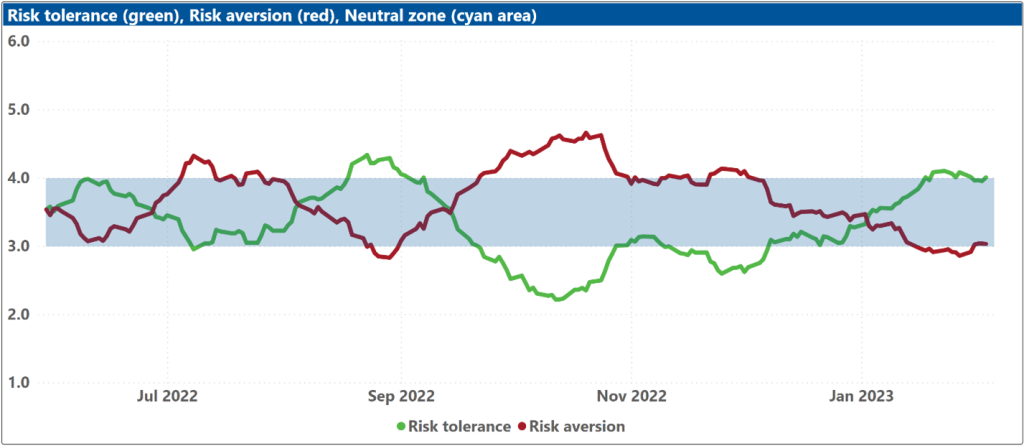
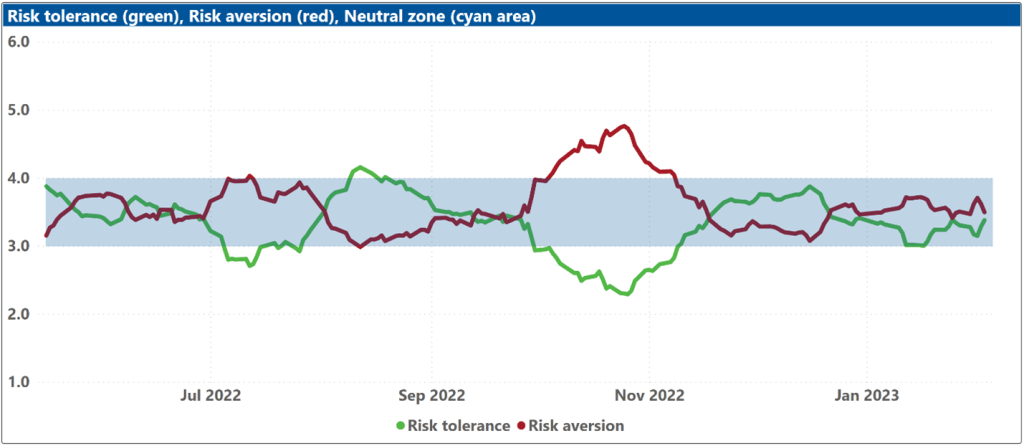
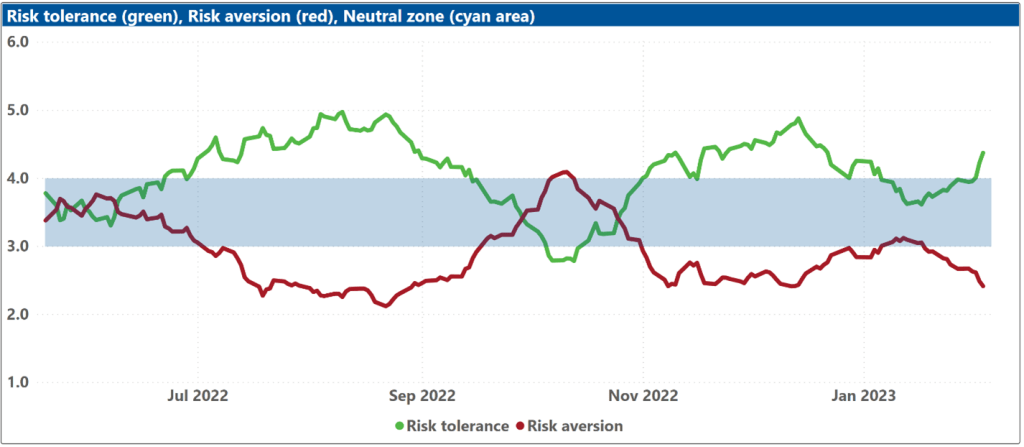
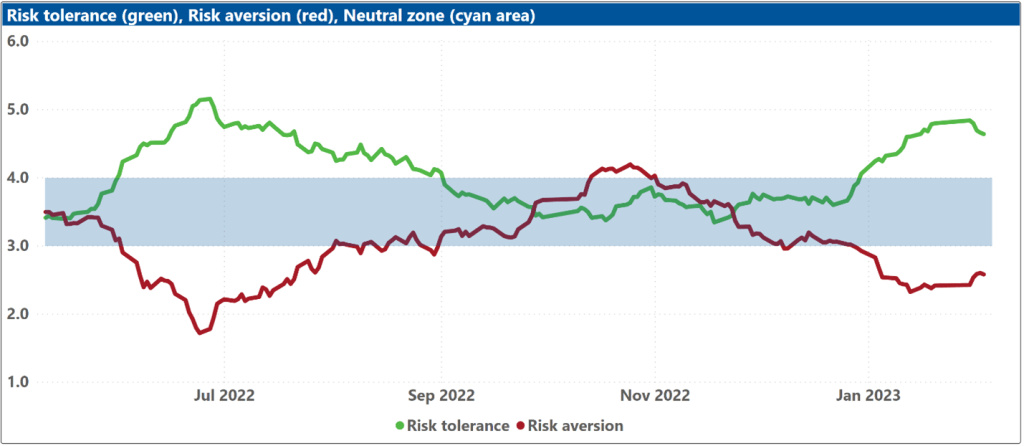
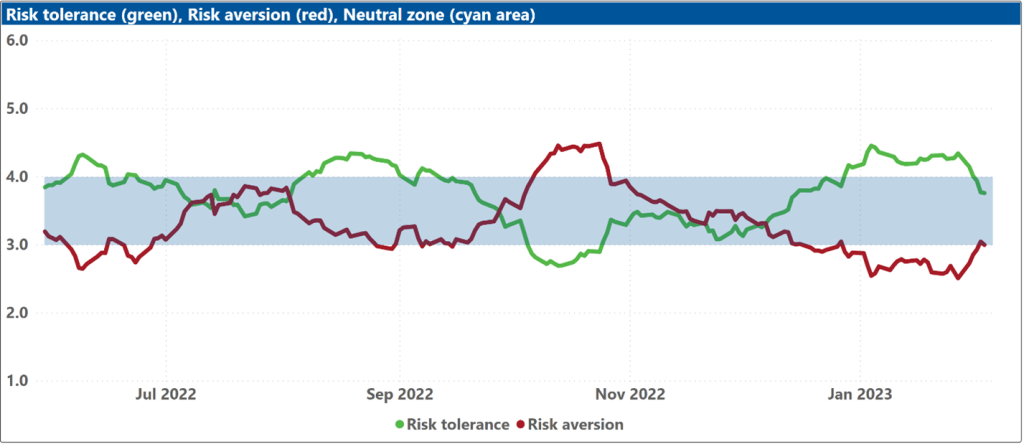
The bottom charts show the levels of both risk tolerance (green line) and risk aversion (red line) in the market. These represent investors’ demand and supply for risk. The net balance between those two is used to compute the ROOF ratio in the top charts, representing overall investor sentiment.
The blue shaded zone between levels 3-4 for both indicators represents a reasonable balance between the supply and demand for risk in the market. Conversely, when both lines are outside of this blue zone, the large imbalance in the demand and supply for risk can lead to an overreaction to unexpected news or risk events.
Jump to a specific market
US:
Europe:
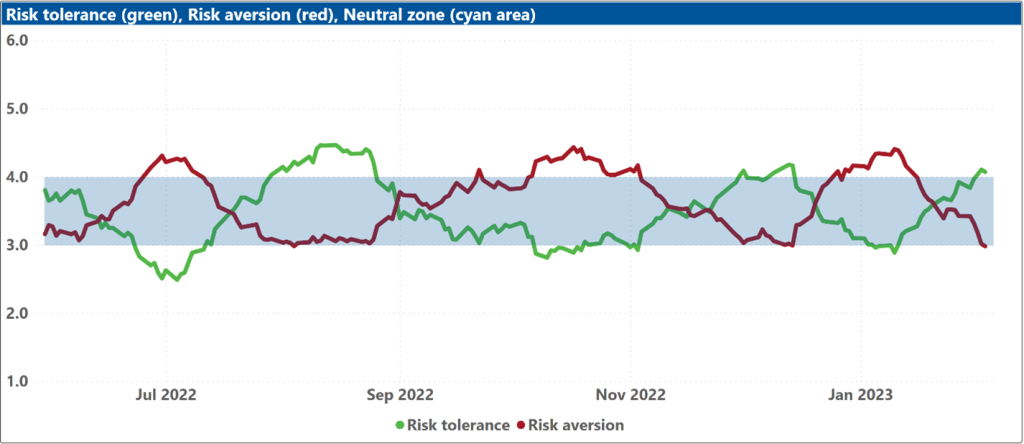
UK:
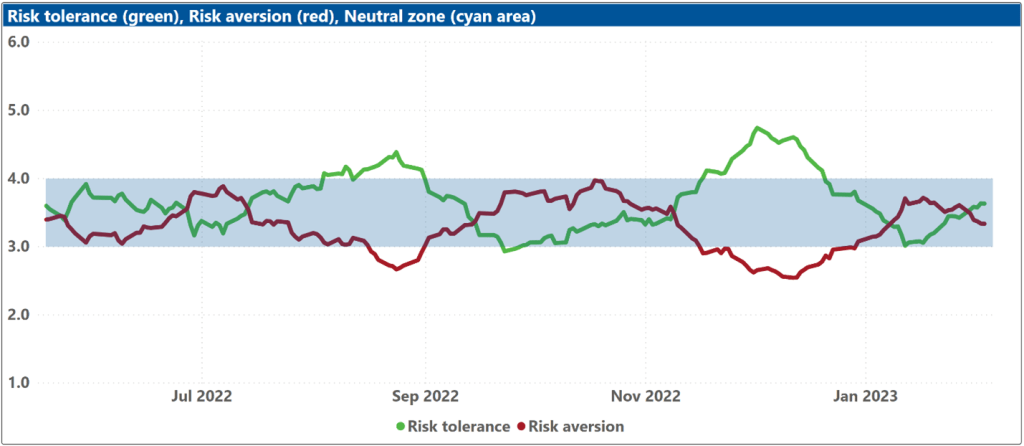
Developed markets:
Developed markets ex-US:
Asia ex-Japan:
Japan:
Australia:
China:
Emerging markets:
1 If sentiment is bearish/bullish, a negative/positive surprise on these data releases could trigger an overreaction.


