
Potential triggers for sentiment-driven market moves this week1:
- US: Inflation and retail sales data; any contagion from SVB’s bankruptcy.
- Europe: ECB interest rate decision (+50bps expected), Christine Lagarde’s press conference; UK budget statement and jobs report; Eurozone’s final inflation figures and industrial production for February.
- APAC: China industrial production and retail sales data for January and February; BoJ’s minutes from last week’s rate decision meeting.
- Global: Any fallout from SVB’s collapse on the global banking sector.
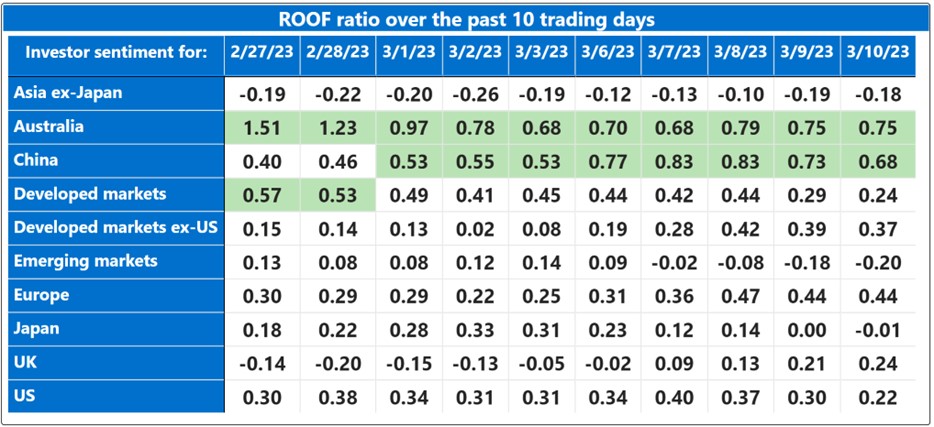
Insights from last week’s changes in investor sentiment:
Investor sentiment declined slightly last week in markets directly affected by the direction of US interest rates (i.e., the US, Asia ex-Japan, emerging and developed markets, and, strangely, Japan), as the focus turns to this week’s US inflation report and next week’s FOMC meeting. In markets with independent interest rate decisions (i.e., the UK, Europe, developed ex-US markets, Australia and China), sentiment was little changed or rose marginally. In Japan, sentiment was hit by the weakening dollar against the yen following fears of a fallout from the SVB bankruptcy (the Japanese yen acting as a haven currency), as well as news that the business survey index of large manufacturing firms declined to its lowest reading since the second quarter of 20202. Globally, sentiment remains under pressure from the various monetary policy decisions and an uncertain macro and geopolitical environment.
For the monetary policy pivot hopeful, last week was not a week of wish fulfillment, least of all the fulfillment of their wishes. On Tuesday, Fed Chair Jerome Powell told investors in no uncertain terms, that the guaranteed 2023 pivot thesis had been brought to them by the same people who brought them Fat Chance. On Wednesday he qualified his remarks to add that data showing a continued resilience in the economy would be met with larger rate increases by the Fed. And on Friday, the labor department released data showing that the US economy unexpectedly created 311,000 jobs in February, well above economists’ forecasts for 205,000. Additionally, as a kind of malus for investors, markets were hit by news of the second-biggest bank failure in US history with the bankruptcy of Silicon Valley Bank (SVB). Ouch. Game. Set. And match.
Investors have always had a strong and distinctive distaste for regulatory intervention and the uncertainty that comes with it, giving them a feeling that their fate is no longer held by the invisible hand of the market but by a very public and sometimes adversarial one with its own agenda. Their only defense becomes an investment thesis based solely on when this intervention will end. Even if this week’s US and Eurozone inflation data confirms the recent downtrend, central banks will remain hawkish for some time because getting rid of inflation without addressing its key drivers, would be like shutting off a fire alarm while the fire’s still going. For now, the message from central bankers seems to be: ‘We raised rates very rapidly last year and now we must wait and see if it worked, and if that’s the case, then, that’ll be, like, totally awesome. And if not, then we’re going to have to go to the mattresses.’
In most markets, except Asia ex-Japan and emerging markets, risk tolerance remains higher than risk aversion, but only just. Last week’s testimony by Powell and this week’s upcoming press conference by ECB president Christine Lagarde could well reverse the supply-and-demand balance for risk in global markets, leaving the pivot theory in tatters. Its remaining followers, if any, will adopt a new, humbler plea: ‘Monetary father, who art at the Fed, your rate hikes are feared, at home as they are overseas. Give us this month our smaller rate hike. And limit our drawdowns, as we, in turn, forecast smaller returns from markets. And lead us not into recession; but deliver us from losses. Ahem.’
No matter what this week’s inflation data for the US and Eurozone show, Powell and Lagarde will say nothing new. They have learned from the experience of trying to do a difficult job so thoroughly second-guessed by investors, when to talk some, and when to leave some. Their press conferences, as the Brits say, never get any further than warming the teapot. Both sympathize with investors’ natural inquisitive instincts but do not submit to them and have become masters at displaying empathy while delivering equivocation. Faced with a draw between inflation and central banks, the game goes into overtime. Look for sentiment to drift lower until clarity returns, and the game can be called.
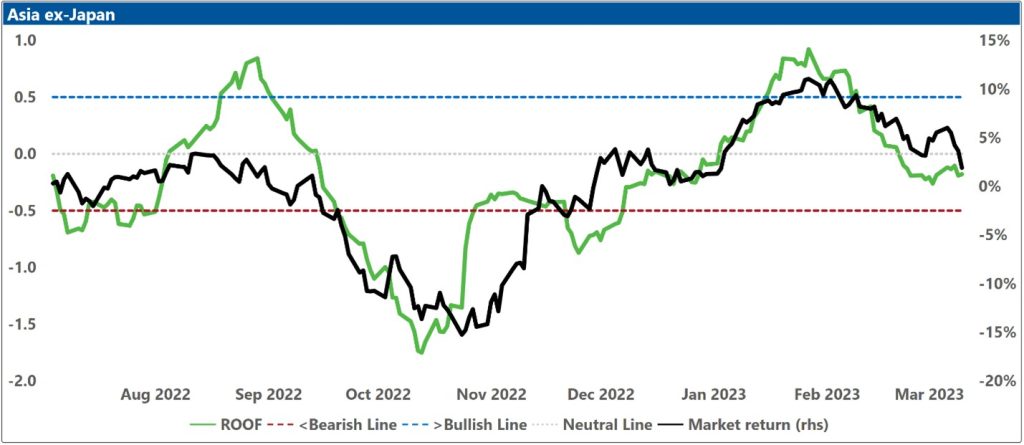
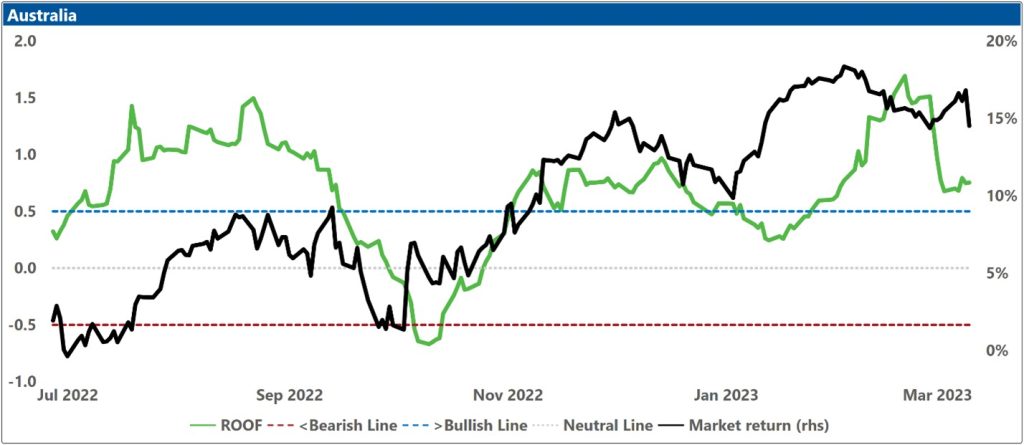
Changes to investor sentiment over the past 180 days for the markets we follow:
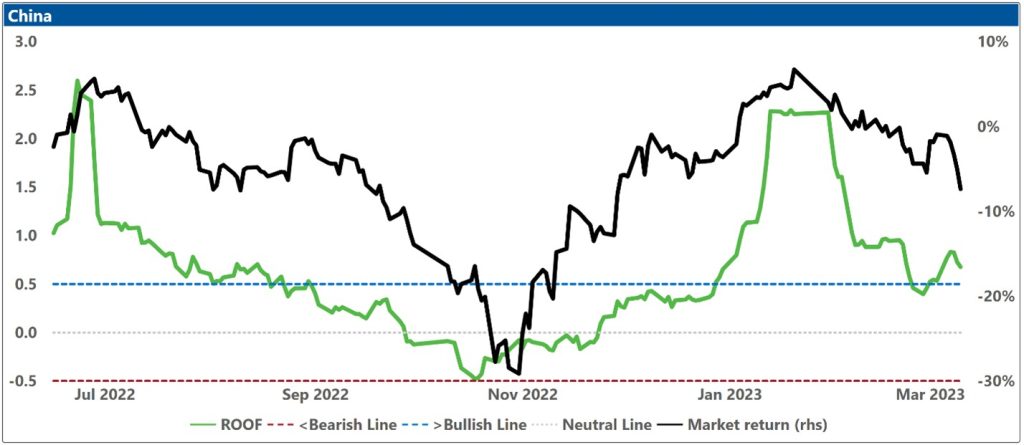
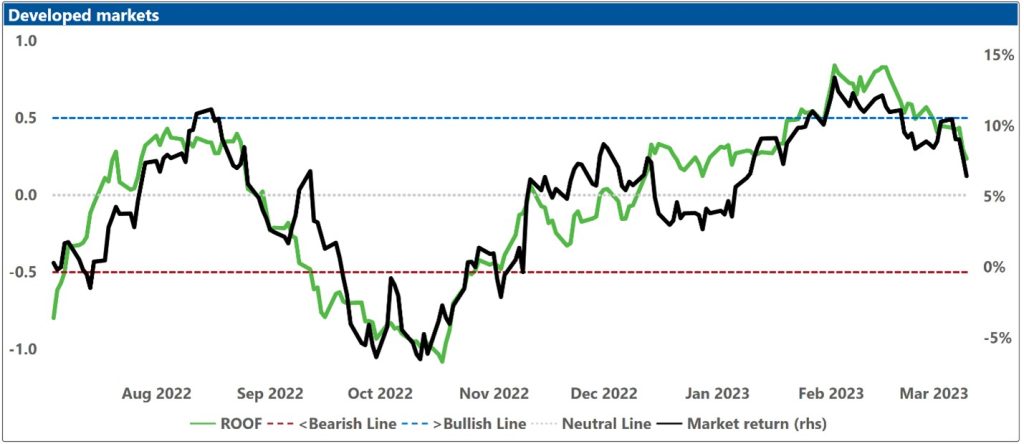
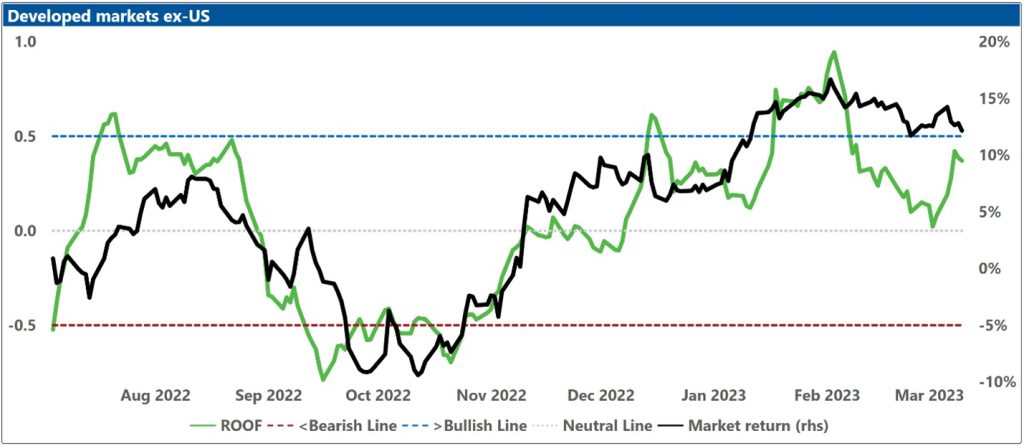
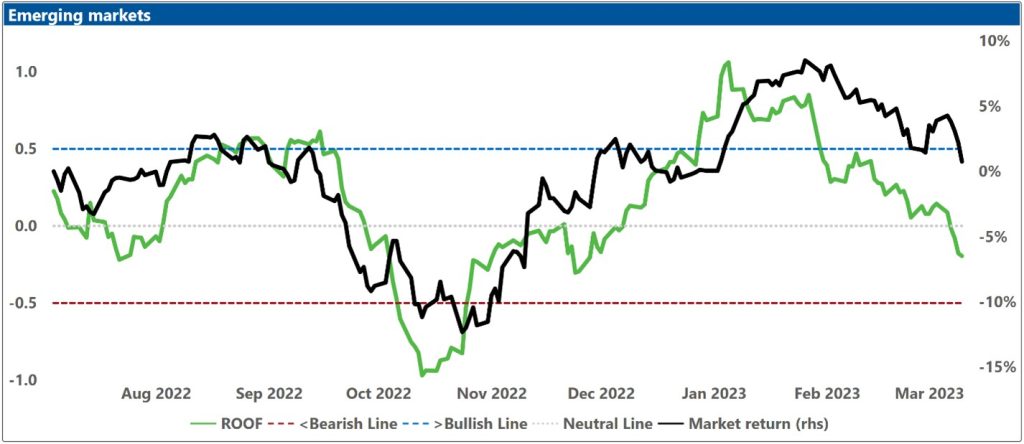
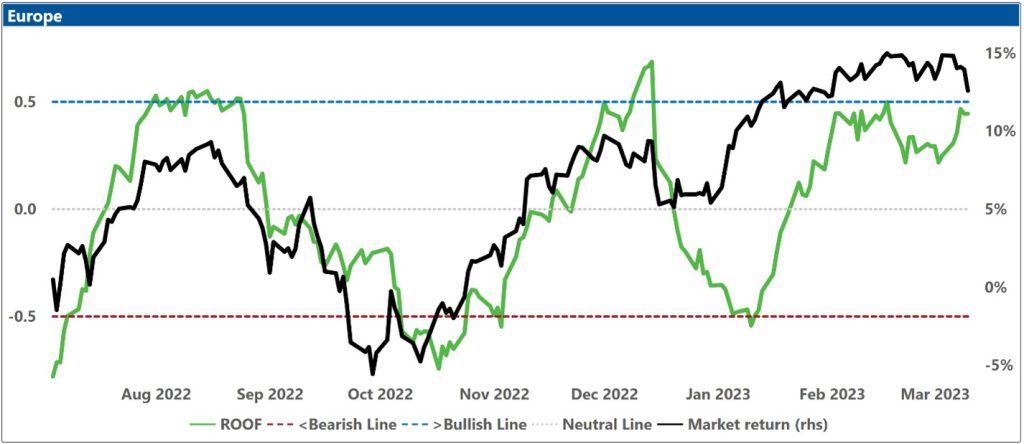
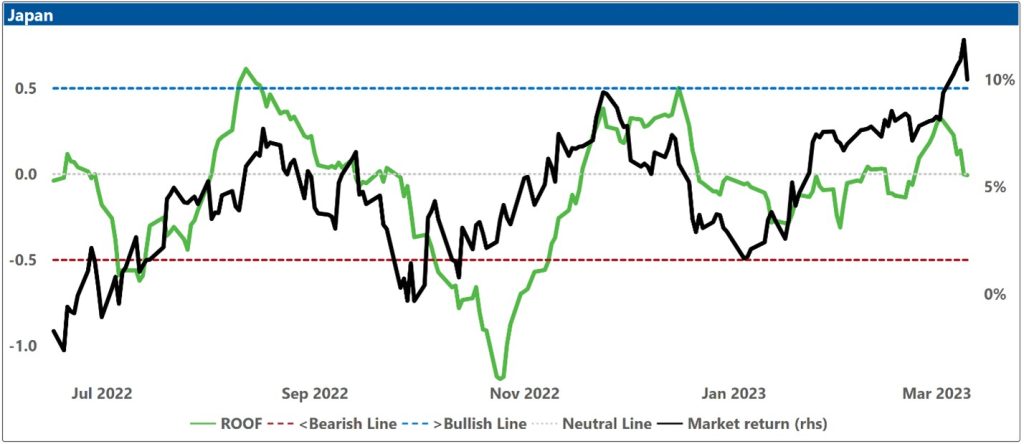
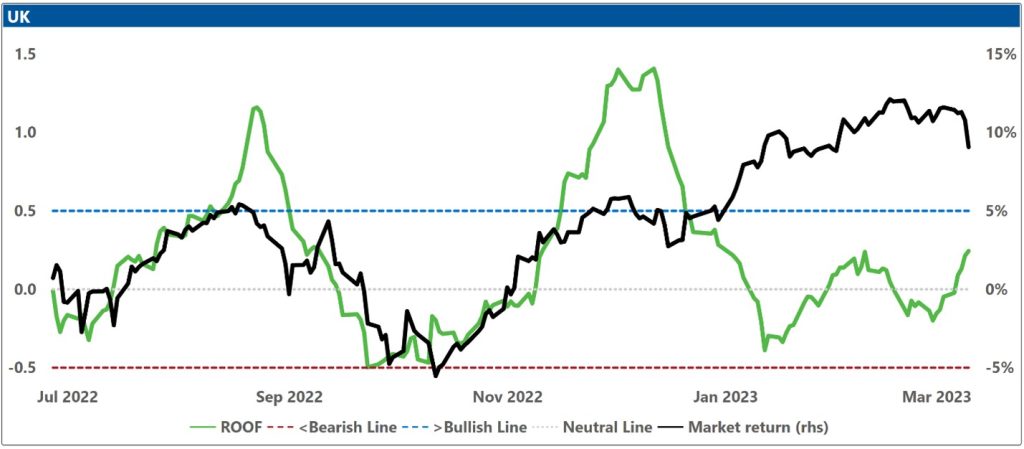
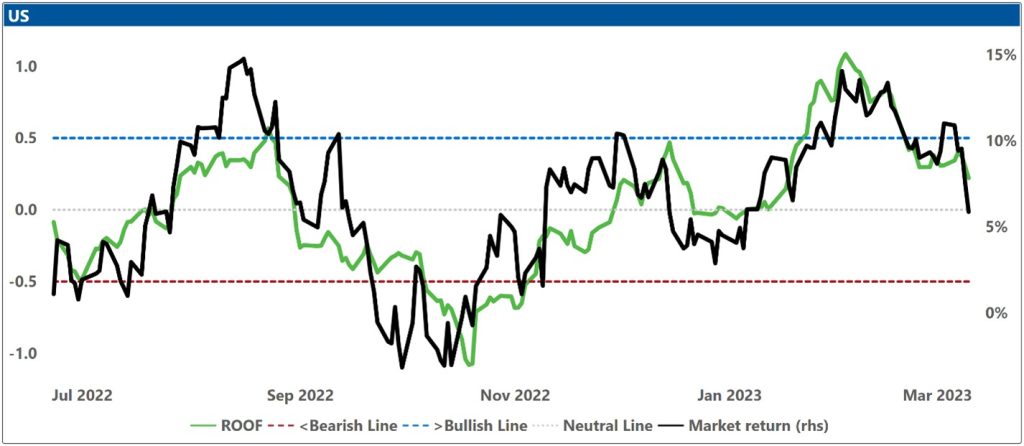
How to read these charts: The top charts show the ROOF ratio (investor sentiment) in green (left axis), against the cumulative returns of the underlying market in black (right axis). The horizontal red line at -0.5 (left axis) represents the frontier between a negative sentiment (-0.2 to -0.5) and a bearish one (<-0.5), and the horizontal blue line at +0.5 (left axis) represents the frontier between a positive sentiment (+0.2 to +0.5) and a bullish one (>+0.5). In between those two lines, sentiment can be considered neutral (-0.2 to +0.2).
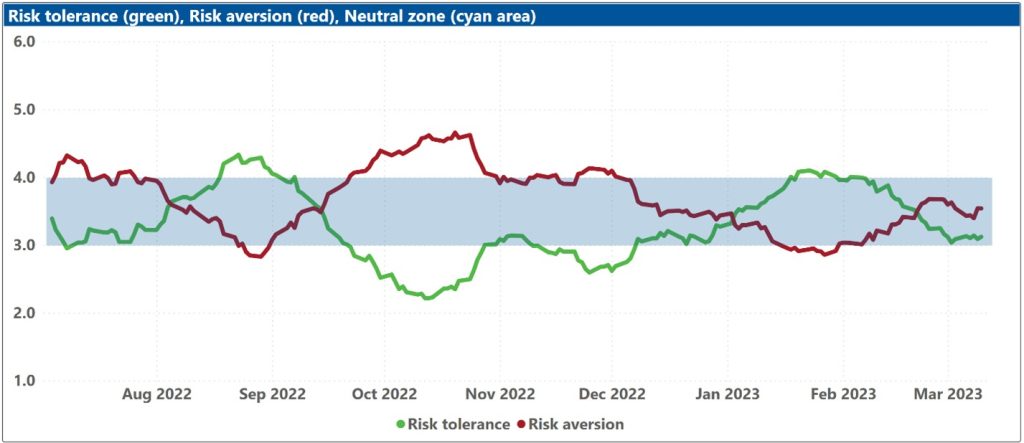
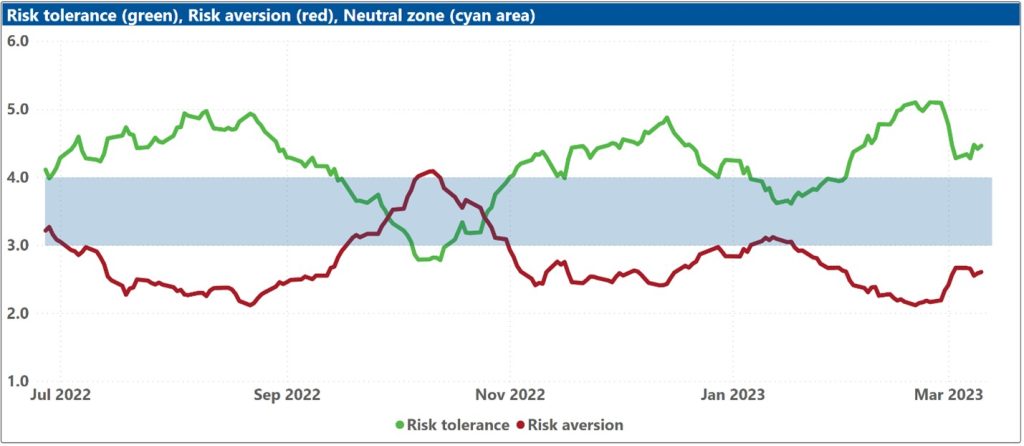
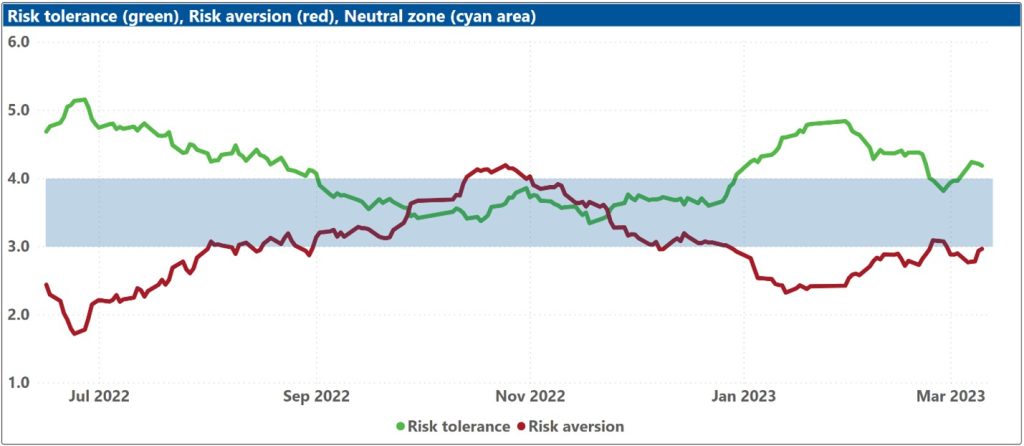
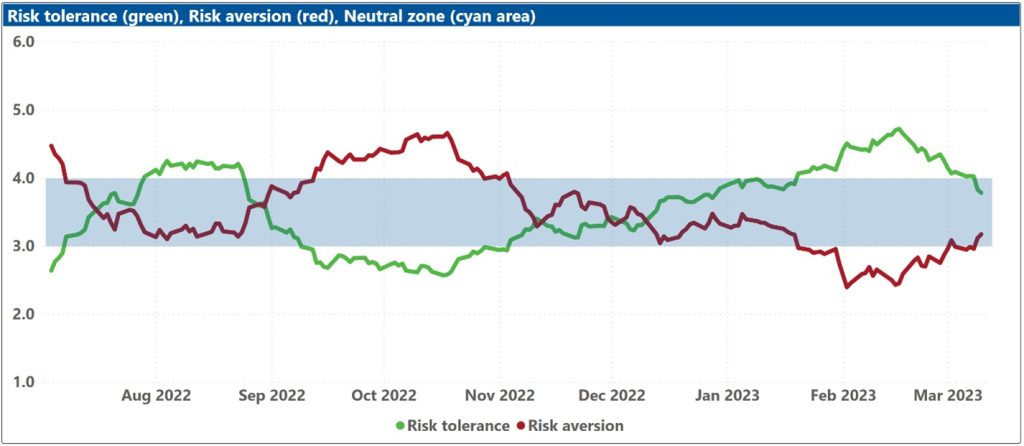
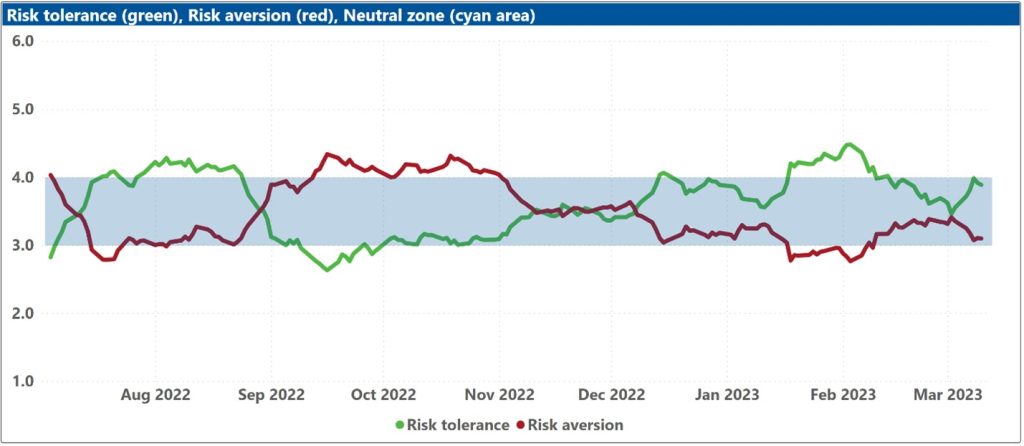
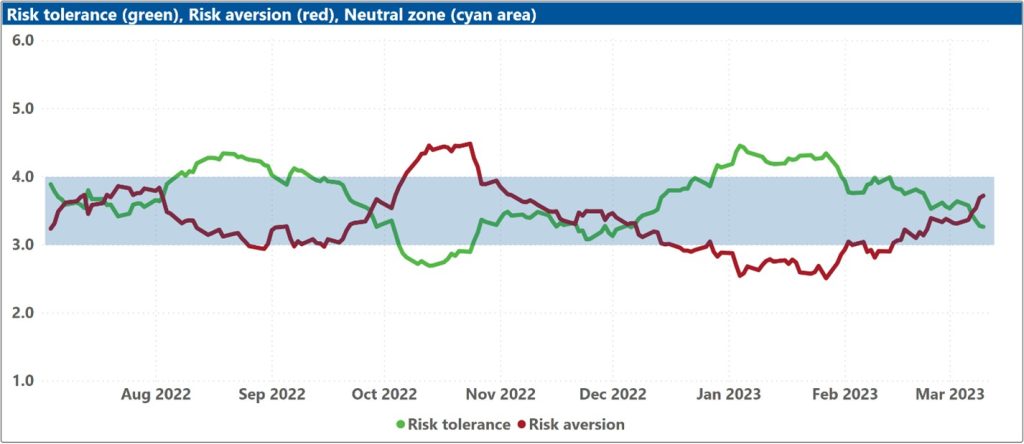
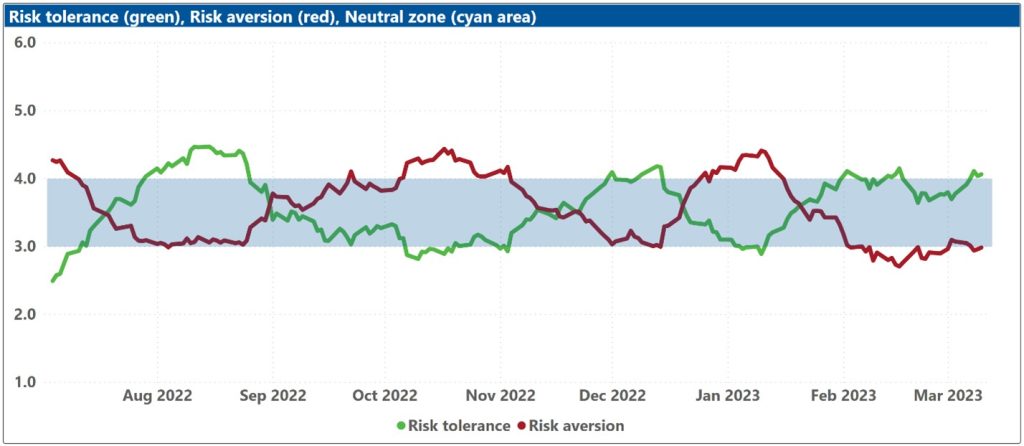
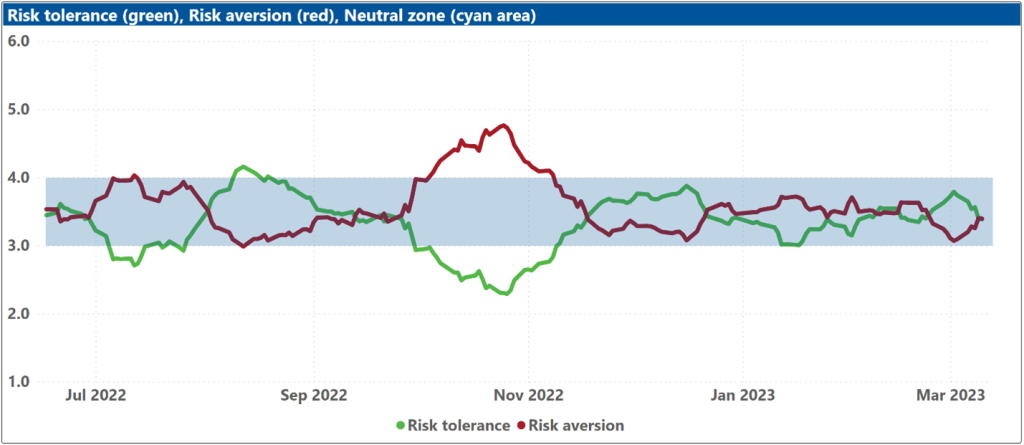
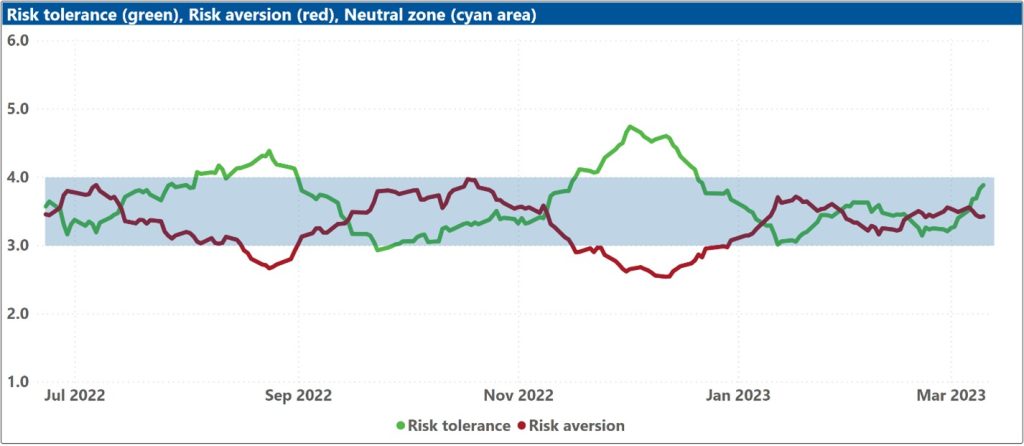
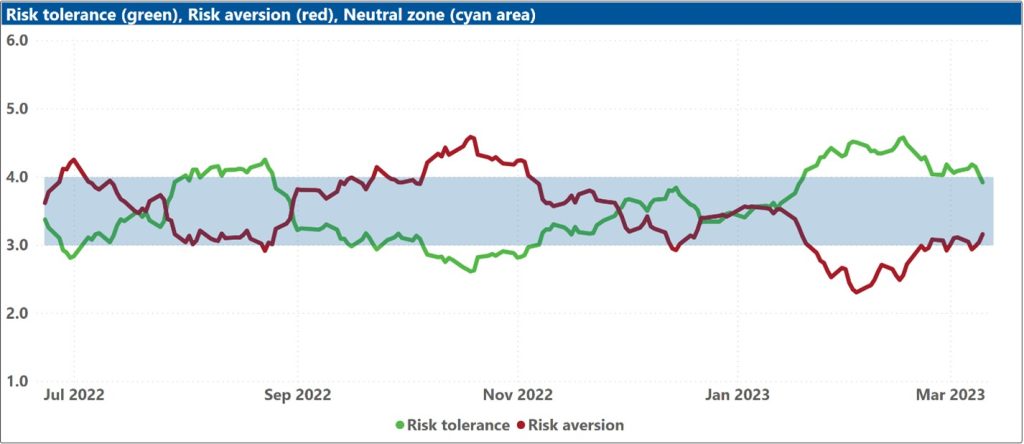
The bottom charts show the levels of both risk tolerance (green line) and risk aversion (red line) in the market. These represent investors’ demand and supply for risk. When risk tolerance (green line) is higher than risk aversion (red line), there are more investors looking to buy risk assets then investors willing to sell them (at the current price), forcing risk-tolerant investors to offer a premium to entice more risk-averse counterparts to take the other side of their trade, which drives markets up. The reverse is true when risk aversion (red line) is higher than risk tolerance (green line). The net balance between risk tolerance and risk aversion levels is used to compute the ROOF ratio in the top charts, representing the sentiment of the average investor in the market.
The blue shaded zone between levels 3-4 for both indicators represents a reasonable balance between the supply and demand for risk in the market. Conversely, when both lines are outside of this blue zone, the large imbalance in the demand and supply for risk can lead to an overreaction to unexpected news or risk events.
Jump to a specific market
Asia ex-Japan:
Australia:
China:
Developed markets:
Developed markets ex-US:
Emerging markets:
Europe:
Japan:
UK:
US:
1 If sentiment is bearish/bullish, a negative/positive surprise on these data releases could trigger an overreaction.
2 The business survey index measures the percentage of firms that expect the business environment to improve from the previous quarter minus the percentage that expect it to worsen..


