

Qontigo’s new Axioma US Equity Factor Risk Model: Trading Horizon (Trading Model) helps managers with shorter investment horizons to better understand and manage their risk. That said, it is not only for traders. When the market abruptly and sharply changes direction, or when there is a substantial rotation from one set of stocks to another, this Trading Model picks up the associated volatility much more quickly. Even users of medium-horizon models can leverage the Trading Model to better handle on short-term portfolio risk and its implications.
To illustrate this, we first look at US equity market volatility during three periods of crisis, including the very recent bumpiness we have seen. The quicker reactions of the Trading Model relative to the short- and medium-horizon variants of the Axioma fundamental equity models are evident in each case.
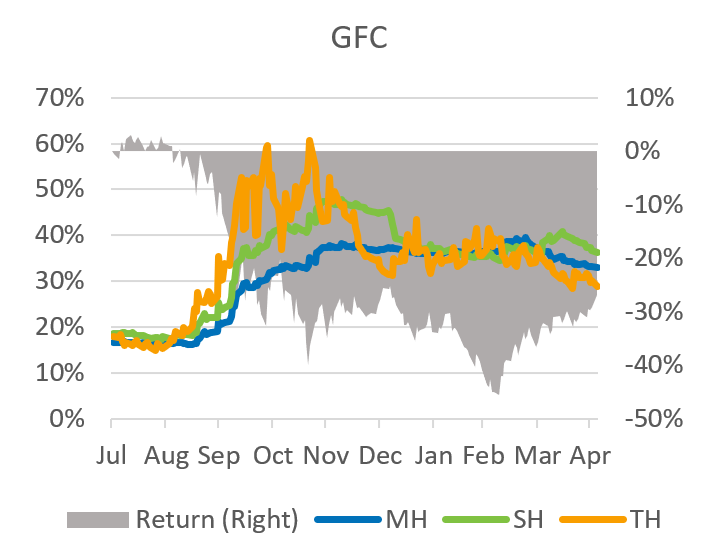
Global financial crisis
We examine the period from the end of July 2008 through the end of April 2009, a time dominated by the global financial crisis. Though there were clear signs of trouble as early as 2006, the “official” onset of the crisis is usually associated with the failure of Lehman Brothers in September 2008. In Exhibit 1 below, we see that the three model variants had similar risk forecasts through August of 2008 and reached a near-term low at the end of that month. But on August 26, the predicted risk reported by the Trading Model rose 10% from the prior day (14.8% to 16.4%), commencing its long upward path through October, pointing to the underlying crisis bubbling under the surface more quickly. Risk of the short- and medium-horizon variants rose much more slowly. By September 22, all models had seen substantial increases, with medium-horizon volatility up 17%, short-horizon up 33% and trading-horizon up 63%.
Just as important, as the market settled down in November, at least temporarily, trading-horizon risk reflected the decrease in volatility much more quickly, dropping by half from the peak by early January 2009, and falling below that of the other two variants. The market dropped substantially once more from January through early March, and trading-horizon risk once again recognized the renewed volatility. It subsequently dropped quickly after the market bottomed out in early March, and by the beginning of April was again below the other two. By the end of April, with the market recovery in full swing, risk forecasts from each of the models were once again much more in line with each other.
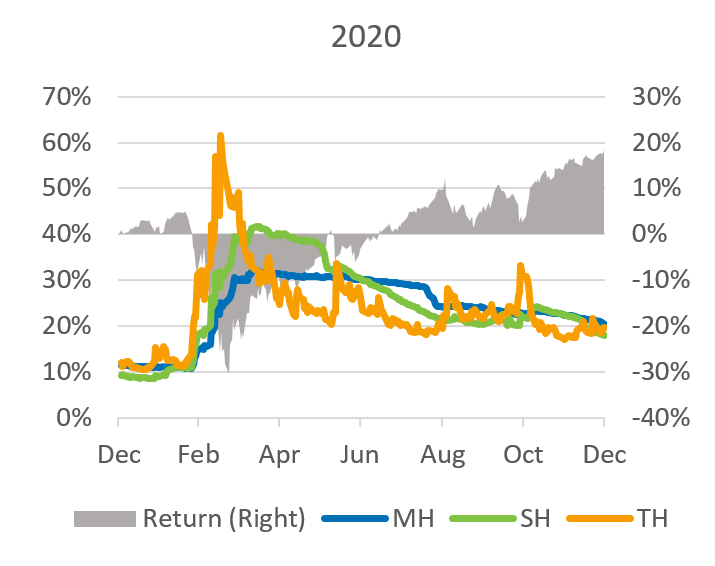
First wave of COVID-19
Here we looked at full-year 2020 to illustrate the calm before the COVID-19 storm, the impact of the sharp but short-lived decline in stock prices associated with the lockdowns, and the subsequent market recovery.
2020 got off to a quiet start. In fact, predicted volatility from all models was near historical lows, as few grasped the enormity of the oncoming crisis. By February 20, though, as the news turned bad, the market started to plunge. On March 13 alone, US stocks were down about 12%, the worst one-day return in at least 20 years. On March 16, predicted volatility from all three model variants saw some of the largest one-day increases in model history (all in the top 1%), but the increase in the Trading Model volatility of almost 40% dwarfed the roughly 12% increases of the other two.
Interestingly, that day saw the peak in risk for the Trading Model, while the other two continued to climb for another couple of weeks, even as the Fed announced a wide array of plans that included lowering the target fed funds rate, keeping rates near 0%, continuing massive quantitative easing, backstopping money market funds, and on and on. During that period, the equity market recovered, erasing all of its March losses by early June. By then the predicted risk according to the Trading Model had fallen to a third of its peak and was about 10 percentage points lower than that of its longer-horizon counterparts. A substantial market decline on June 10 led to a quick jump in trading-horizon risk, but in general it continued to decline through August. Risk from the other models also declined. Their declines were much slower, albeit without the periodic spikes we saw in the Trading Model after big down days. We would also note here that, as usual, markets tend to drop quickly but rise slowly. Market gains generally do not, therefore, result in risk spikes.
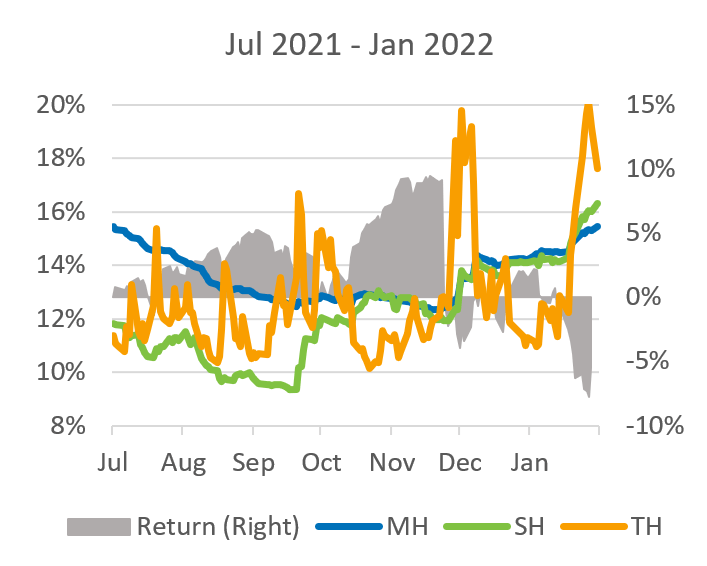
Omicron and the recent mini tech-bubble burst
Market volatility was also high in late November, when the Omicron variant suggested we were not yet out of the COVID woods. Trading-horizon predicted risk approximately doubled in November, but fell back substantially by the end of the year. At the same time, medium- and short-horizon risk both rose, but by less than two percentage points.
Since the end of 2021 we have experienced what may, in retrospect, be a bursting of the current tech “bubble” (or may just be a small market blip — it is too early to tell). The specter of inflation and the Fed’s efforts to fight it with higher interest rates are currently duking it out with reports of a strong economy. Through January 27 the market had fallen almost 10% year to date, although it has recovered somewhat since then. Still, while trading-horizon risk has jumped, like that of its counterparts, it remains well below levels seen in 2020 and even 2021. As of this writing, though, the US equity market’s trading-horizon risk remains well above the others.
Why is parsing the differences in risk-model forecasts useful even for investors with longer horizons? Consider the following:
- As we have often noted about the short-horizon model, it tends to be a leading indicator vis-à-vis the medium horizon. We can view the Trading Model in the same way: as trading-horizon risk changes substantially, the models many of our clients use to rebalance their portfolios are likely to follow on its heels. Some may not want to trade “today” when they know they will have to trade again “tomorrow” because risk will have increased, and they will need to bring risk in line with budget. (An upcoming post will look at active risk rather than total risk as we have used here, but the conclusions are similar.)
- While longer-horizon models work extremely well in “normal” markets, investors may want to turn to our new Axioma US Equity Trading Horizon Model to understand what is happening to their portfolios in times of crisis, as we have illustrated above. Even if they don’t use the model to trade, just understanding the sources of ultra-short-term risk and return can be extremely helpful in making investment decisions and explaining results to clients.
- Although we have not discussed the additional components of the new Trading Model on top of what is included in the other horizon models, some of those factors, such as Hedge Fund Crowding or Downside Risk, may help identify opportunities or threats to a portfolio. (See here for a description of the additional factors.) For quantitatively driven investors, these factors can easily be added to an optimization, even if the risk target is based on a different horizon model.


