

Qontigo’s ROOF Scores were created to quantify market sentiment—in other words, bullish or bearish? ROOF is an acronym for Risk-On/Risk-Off market conditions[1]. ROOF Scores are calculated from the factor returns to eight style factors from Axioma’s fundamental factor risk models, plus two indicators of changing market volatility. Together, these 10 metrics are used to compute risk-tolerance and risk-aversion scores. To quantify the overall market sentiment, we simply take the difference between the two (risk-tolerance minus risk-aversion).
Factor returns are subject to the same supply-and-demand market forces that drive stock prices. Therefore, if a factor has a positive return, it is because the demand for it outweighed the supply. By mapping each of the risk factors to either a risk-tolerant or risk-averse strategy, we obtain an aggregate measure of the balance between those two investor types to answer the question: “Are there more risk-tolerant investors in the market or risk-averse ones?”
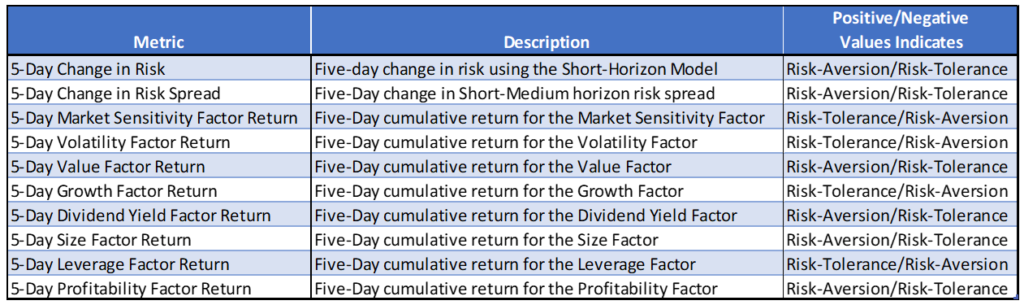
The 10 metrics used are as follows[2]:
We generated the scores for risk-tolerance and risk-aversion for eight markets going back to early 2006. In general, we observe that when risk-tolerant investors outnumber risk-averse ones (leading to a greater demand for risk assets than supply), markets tend to go up. When risk-averse investors outnumber risk-tolerant ones (leading to a greater supply of risk assets than demand), markets tend to go down. And when there is a supply and demand balance between risk-tolerant and risk-averse investors, markets tend to move in a tight range with low volatility.
We also noted that the risk-tolerance scores tend to peak and slowly decline prior to a market correction following a prolonged rally. Often, risk-aversion also begins to rise beforehand, too. Our explanation for this is that as more and more risk-tolerant investors reach their investment goals during the rally, their risk appetite diminishes and, while not yet ready to join the ranks of the risk-averse investors, they become more prone to profit taking, using any excuse to lock in their previous gains. This, in turns, drives down factor return for the risk-tolerance strategy metrics, thereby benefiting the risk-averse one.
We will be using and refining the ROOF Score methodology in our market commentary blog posts, as well as including them in our quarterly Insight webinar for discussion. Do reach out to your Qontigo representative if you would like more information on the ROOF Scores for your market (we calculate them on eight different markets daily) or for us to generate a chart for you until we finalize our production decision.
How we define risk-tolerant and risk-averse…
A risk-tolerant strategy is one that loads on the riskier segments of the market in order to derive leveraged returns from a generously optimistic forecast on the direction of future stock prices. This might include betting on high-beta, volatile, non-dividend-paying small-caps of high growth companies, with low or negative earnings, and a large amount of debt (think tech bubble market of the late ’90s). Risk-tolerant investors tend to be undeterred by rising market volatility, equating higher risk with the potential for higher rewards.
A risk-averse strategy seeks refuge among the safest segments of the market in order to limit downside risk when confronted with market weakness or a pessimistic (or increasingly opaque) forecast about future market conditions. This might include betting on low-beta, low volatility, high dividend-paying large-caps of value companies, with high quality earnings, and no debt (think post-2008 market). Risk-averse investors’ search for safety only increases with rising market volatility, equating higher risk with the potential for higher losses.
[1] We thought it rolled off the tongue better than “Quantitative process for using systematic fundamental factor returns to identify the contemporary behavioral attitude of investors towards risk in the stock market…”.
[2] Note that a full description of the rationale for each is available from the paper “Beyond Volatility: Detecting Risk-On/Risk-Off Sentiment Through the Lens of a Risk Model” available here, and the blog post “Is Investor Sentiment Subject to Seasonality?” available here.


