

Our recent blog post on factor performance discussed factor returns on an absolute and risk-adjusted basis during the recent market downturn. Many of the returns were shockingly bad, but looking at the full period masks just how painful things were on a daily basis. Managing active risk was particularly challenging, as most days saw several factors produce outsized returns—and on many days, it was a majority of factors that did so.
On top of that, a number of typically compensated factors[1] frequently moved opposite to the expected direction. From this perspective, this period of pain in factor world has already long exceeded that of the 2007 quant crisis (aka quant quake), which really lasted only about five days[2]. Also, at the time market returns were “normal”, so the pain was in the active space, but not on top of the already crushing returns we are seeing now. This time around, much of the factor behavior reflect genuine and deep economic concerns.
Of course, both the quant crisis and the current period saw outsized and returns and sharp increases in factor volatility, with many style factors exhibiting unusually deviant behavior.
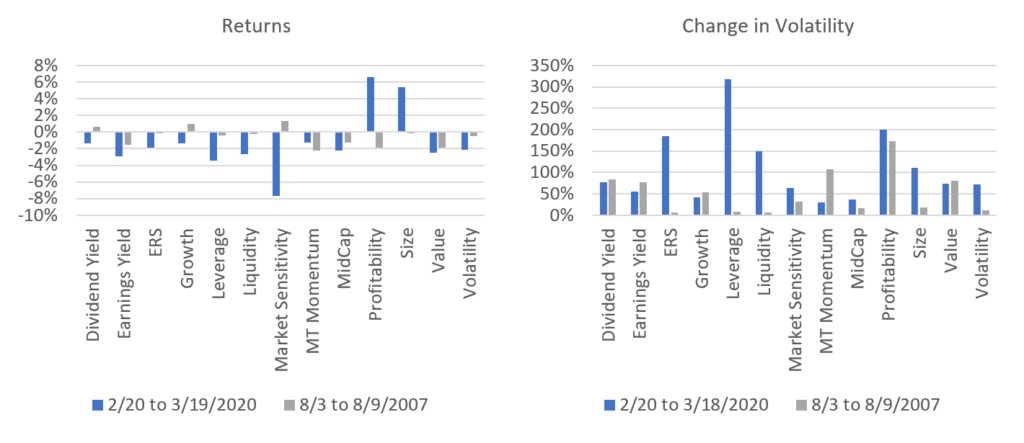
Outsize returns were not necessarily in the same factors (Exhibit 1). While Earnings Yield, Value and Medium-Term Momentum faltered in both periods, the strength of the economic concerns driving the current market downturn is reflected in the highly negative returns to Leverage, Liquidity, Market Sensitivity and Volatility. And the huge positive return to Size was not observed in the earlier period. Recent returns were also of much higher magnitude than those that had a rough time in both periods. In addition. concerns about economic fallout in the current period has driven investors towards strongly profitable companies, whereas the Profitability factor return was negative in 2007.
Factor volatility increased across the board in both periods, but this time—again, given the absence of economic concerns in 2007[3]—Exchange Rate Sensitivity, Leverage, Liquidity, Size and Volatility all saw huge increases in their risk. Among those factors, Leverage stands out with its highly negative return and increase in risk. This may have been a factor that investors paid little heed earlier, because it doesn’t typically have a risk premium associated with it. But in the current environment, it may have done some real damage to returns, while simultaneously driving up active risk.
Exhibit 1. Returns and Change in Volatility Comparison
The daily factor pain steadily climbed in the first two weeks of the market downturn. February 28 was the first day since the market began its descent that more than half the factors in the US4 model produced returns of more than two standard deviations, based on their risk forecasts (Exhibit 2). Things then settled down a bit, but most days in March saw a majority of factors with big returns. That period compares in frequency with the five days of quant crisis in 2007. Exhibit 3 shows that different factors had the highest frequency of big daily returns. In those five days in 2007, Dividend Yield, Earnings Yield, Growth, Medium-Term Momentum, MidCap and Profitability had a much higher frequency of big returns compared with the current period, whereas now Exchange Rate Sensitivity (ERS), Leverage and Market Sensitivity stand out. Notably, over the past few weeks Medium-Term Momentum has had the lowest incidence of big returns.
Finally, while the frequency of higher-than-expected return magnitude clearly impacts portfolio active risk, style-based investors are probably most concerned when the sign of that return runs counter to their expectations. A number of the style factors in Axioma’s fundamental models are expected to provide compensation for the risk they bring, and some managers therefore tilt their portfolios on them in order to capture this risk premium in the expected return direction.
Exhibit 4 details the number of days that returns for those ‘trending’ factors ran in the “wrong” direction, with the expected sign next to the factor name. Let’s assume one expects that to happen about 40% of the time (that is, the factor has a 60% hit rate). Here we find that the majority of factors produced “wrong-way” returns in more days than expected. In this sense, Profitability stands out again in the current environment, with far fewer disappointing days than in 2007, and as compared with the other factors. Good to see at least one factor behaving, most likely reflecting investor preference for stocks that are at least currently profitable.
We did not include Leverage in the chart because it does not typically have a premium associated with it over the long term (and therefore a 50% expected hit rate), we note that it has only had a positive return in seven of the 21 days of this study.
Overall, the magnitude of factor returns in the opposite direction of expectations—and the frequency of it—is quite reminiscent of the 2007 quant quake. That said, the factors participating in the downturn strongly underscore the impact of economic concerns on factor performance, much more so than in 2007. And, importantly, these factors were very likely to affect many more managers than just the typically compensated ones.
Exhibit 2. Number of US Factors* with Outsized** Returns
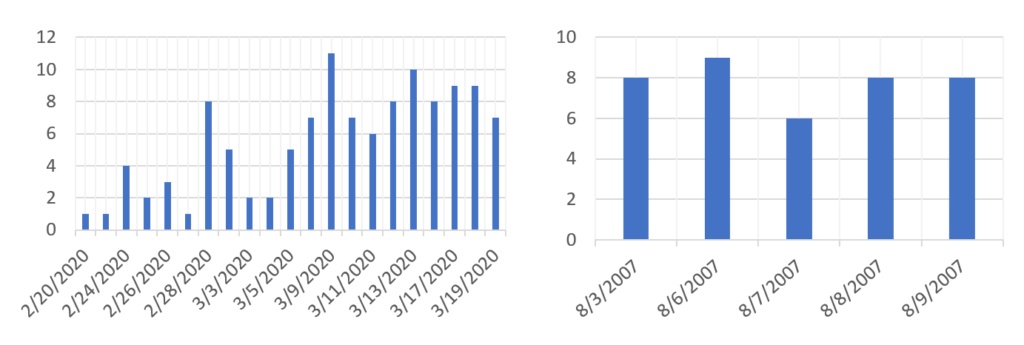
*Out of 14 factors in the US4 model
**Outsized is defined as a move of more than two standard deviations, based today’s return divided by the prior day’s risk forecast.
Exhibit 3. Percent of Days with Outsized* Returns
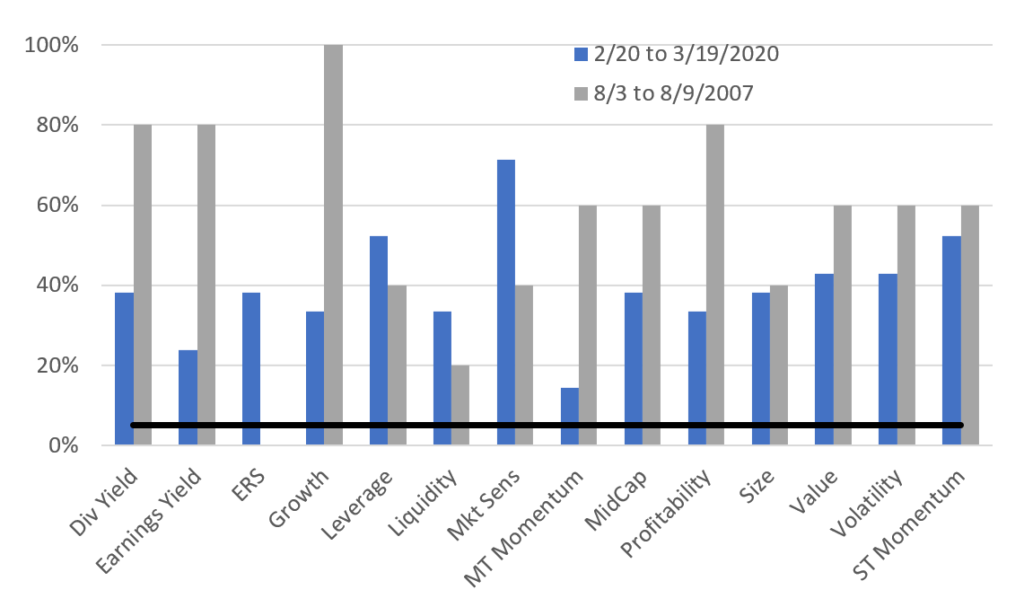
*Outsized is defined as a move of more than two standard deviations, based today’s return divided by the prior day’s risk forecast. The black line represents the expectation and long-term results that a factor’s return should breach that band about 5% of the time.
Exhibit 4. Percent of Days Factor Moved Counter to Expectations*
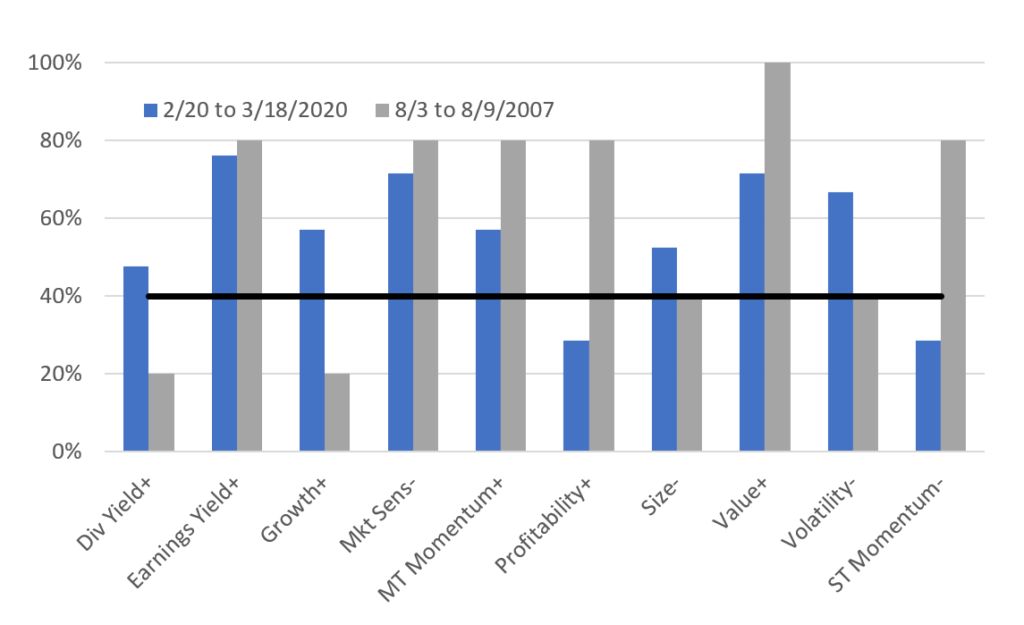
*Expectations for positive returns denoted with “+” in the legend, negative returns with “-”.
[1] The factors that we assume will be compensated, and therefore managers may use as portfolio tilts, include Dividend Yield, Earnings Yield, Growth, Medium-Term Momentum, Profitability and Value, all with expected positive returns, and Market Sensitivity, Size, Volatility and Short-Term Momentum with expected negative returns.
[2] We calculate the period of the 2007 quant crisis as August 3 to August 9.
[3] Until a few months later, of course, when the market peaked before the long, drawn out downturn.


