

As we covered in recent posts, the sharp market downturn of the past four weeks has dragged stocks into a bear market at an unprecedented pace, and caused a spike in volatility not seen since the depth of the financial crisis.
The violent market downturn has also stirred wild daily swings in equities, as shown by the STOXX® Global 1800 Index in Chart 1. Traders and investors have since Feb. 24 weathered extreme session moves – and not just on the downside.
Chart 1
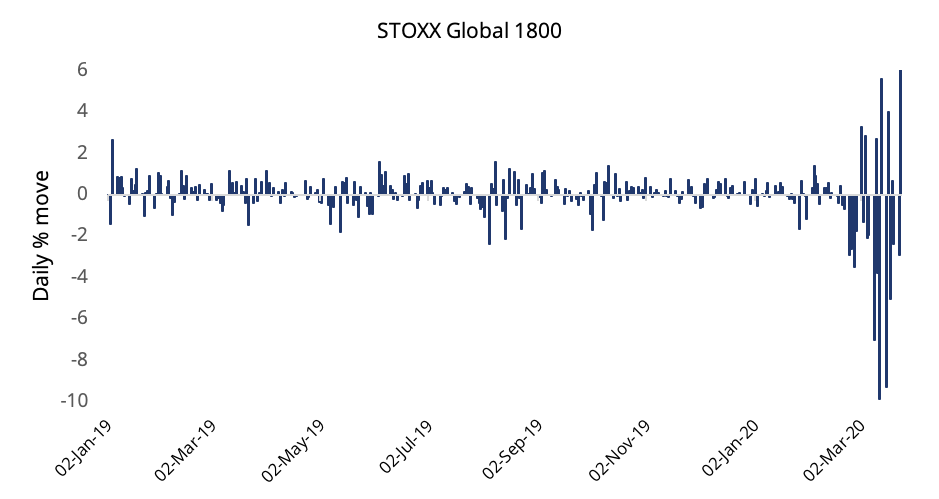
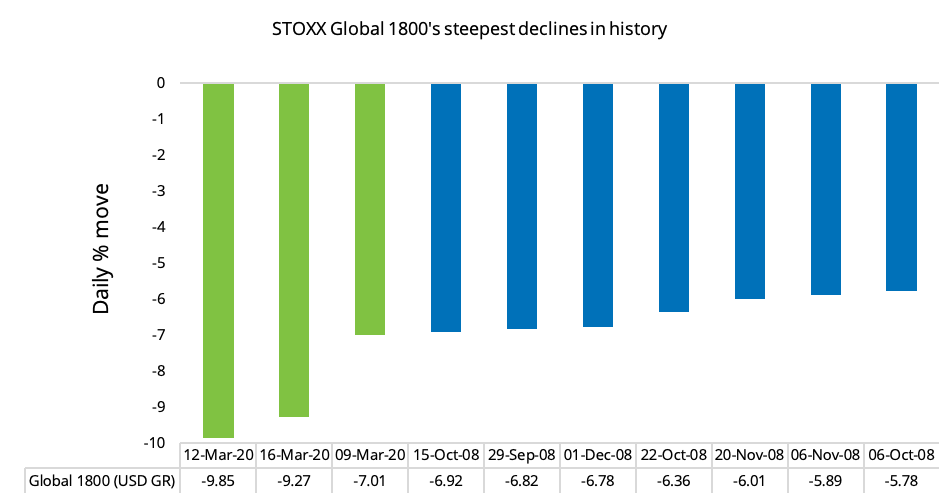
Chart 2 puts the recent market moves into a longer historical context, by showing the ten most extreme drops since index data begins in 2004. The three biggest declines on record, featured in green in the chart, took place in March this year.
Chart 2
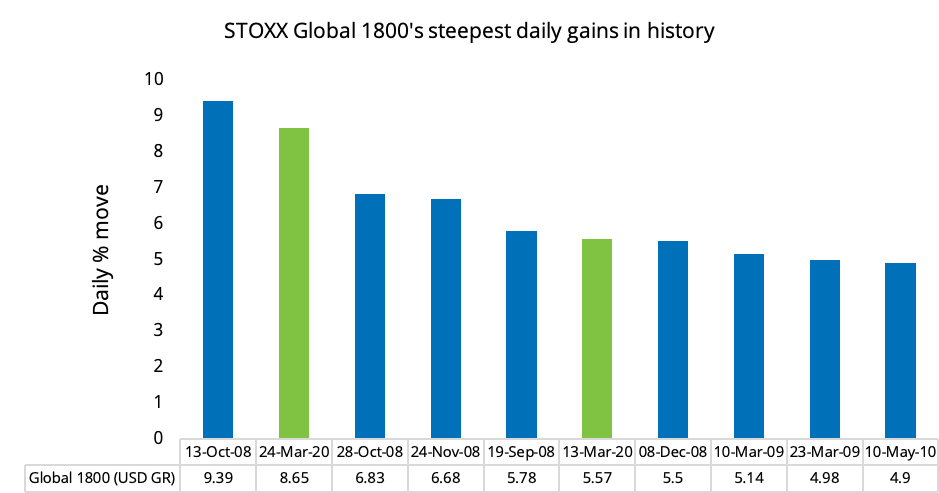
Conversely, severe moves on the downside can be followed by sharp spikes, even during bear markets. Chart 3 shows the ten biggest advances in the global benchmark since 2004. Two of them, marked in green, took place in 2020.
Chart 3
The precedent of 2008
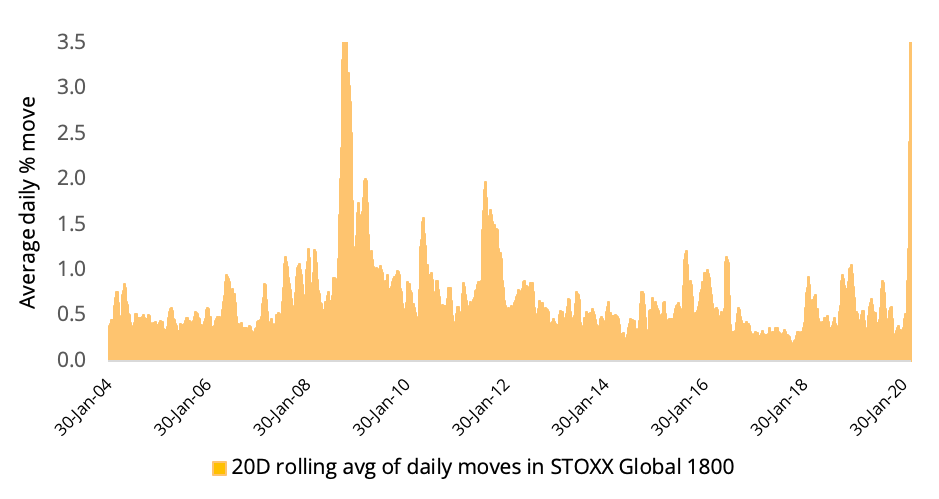
Recent price action has also lifted the 20-day rolling average of absolute daily moves (in either direction) in the STOXX Global 1800 to the highs seen in 2008 (Chart 4).
The latest steepening in price swings (seen at the far-right end of the chart) features as a slimmer spike than that of 2008, as market participants weathered months of stress during the global financial crisis.
Chart 4
Not surprisingly, Chart 4 looks similar to the progression of options prices in recent years as investors buy market protection in times of uncertainty. Chart 5 overlaps the 20-day rolling average of absolute daily moves for the STOXX Global 1800 with the EURO STOXX 50® Volatility Index. The index known as VSTOXX® tracks real-time options prices for the EURO STOXX 50® Index, thus reflecting market expectations of future – or implied – volatility in Eurozone stocks.
Chart 5

The VSTOXX climbed to 85.6 on Mar. 16 this year, its highest level since at least 1999 except only for one day in October 2008 during the depths of the global financial crisis.
Historical perspective
The VSTOXX, which tends to revert towards a mean in the long-term, has had an average reading of 23.7 since 1999.
The volatility index took 13 months to revert back to an average from its global financial crisis high in October 2008, or almost 11 months after the Federal Reserve lowered the key US interest rate to near zero on Dec. 16, 2008.
It took almost four months for the index to return to its average from a May 2010 peak. The European Central Bank that month began open market operations to buy debt securities and bring down the borrowing costs for Europe’s most indebted nations.
The VSTOXX climbed to another high in September 2011 as Europe’s debt crisis flared up again. Almost four months later, and two months after the ECB introduced longer-term refinancing operations and reduced its so-called reserve ratio to strengthen banks’ liquidity, the VSTOXX returned to its historical average.
Central banks including the Fed and the Bank of England in March this year slashed interest rates to record lows to counteract the economic disruption caused by the expanding COVID-19 outbreak. On Mar. 27, 2020, the US Congress approved a 2-trillion-dollar relief program to bolster American consumers’ and companies’ financial standing.
Market outlook dependent on health crisis outcome
If anything, this exercise helps grasp the volatility equity traders have had to contend with in recent days. This creates a historically challenging – as well as potentially rewarding – time. Until investors gain more visibility on the prospects for this health crisis and the true effects on the global economy, and given the historical tendency for VSTOXX to remain elevated for a period of time even after policy interventions, the days of calm trading will likely be just a memory for some time to come.
1 All returns are on a gross basis in dollars.


