

The stock market’s version of the Ellsberg paradox states that investors exhibit ambiguity aversion, in the sense that they prefer risks with known probability measures over risks with unknown ones. Since the probability measure governing future stock market prices is clearly unknown, we can conclude that market volatility is a reflection of investors’ aversion to both risk and ambiguity. The variable existence of the latter means we do not have to witness a market stress event to observe a rise investor’s risk-aversion level; all it takes is rising ambiguity about the probability of its outcomes. If this is true, then we should be able to detect behavior consistent with rising risk-aversion caused by rising ambiguity, before a risk event causes a flight to safety[1].
This is the subject of my recent paper, “Risk-On/Risk-Off, and the Schrödinger Quadrant”. In their study of the financial crisis of 2008, Professors T. Marsh (U.C. Berkeley) and P. Pfleiderer (Stanford U.) describe the market-clearing mechanism that led to a sharp drop in stock prices in these terms:
“Investors who have a lower tolerance for risk than the average investor, i.e., a higher ratio of fear-to-greed, want to adjust their portfolios to be more conservative when risk increases, while those who are more risk-tolerant than average want to make adjustments that expose them to even more risk but allow them to earn commensurately higher prospective returns. Prices must fall to the point where the rewards for bearing risk are high enough for the demand for risky assets to equal the supply.[2]”
In other words, on any given day, it is the balance between risk-tolerant and risk-averse investors that determines the premium – or discount – at which stocks are being exchanged between those two investor types. Rising ambiguity will swell the ranks of the risk-averse investors and therefore the supply of risk assets, while falling ambiguity will increase the number of risk-tolerant ones and therefore the demand for risk assets. This change in the supply and demand determines not only the direction of markets but the durability of market movements as well.
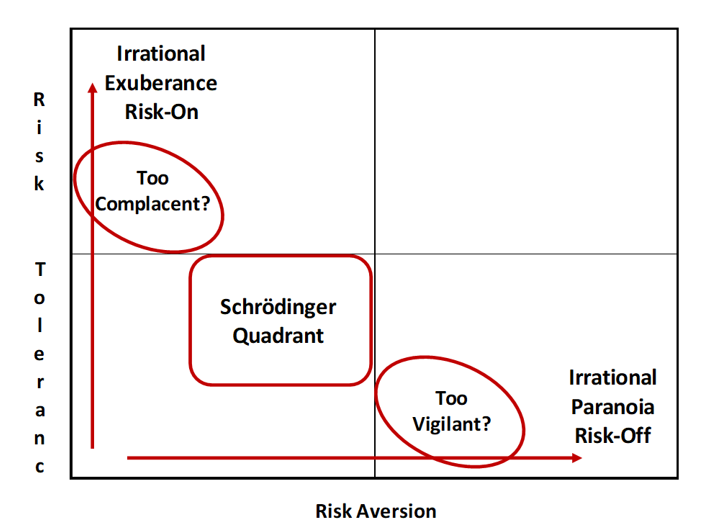
Using eight of the many risk factors from Axioma’s fundamental factor models, I describe a process to measure the levels of risk-tolerance and risk-aversion in the market separately. I then define the supply and demand for risk assets simply as the difference between those two indicators. When there is too much risk-tolerance and not enough risk-aversion in the market, investors may be exhibiting signs of complacency with regards to how much they really know about the probable outcomes of upcoming risk events. Conversely, when there is too much risk-aversion and not enough risk-tolerance in the market, then investors may be overly vigilant in their need for clarity. Most of the time, however, investors are in the Schrödinger Quadrant, being both risk-tolerant and risk-averse at the same time. In this latter state when neither ‘fear’ nor ‘greed’ dominates the other, they tend to behave as rational investors.
Lastly, by focusing on the two neurosis regions of irrational exuberance and paranoia respectively (i.e. strong buy and strong sell signals), I simulate a market-timing strategy that seeks to capture 130% of the market return when the indicators are in the Risk-On quadrant, and only 70% of the market return when they are in the Risk-Off quadrant. I ran this simulation on nine different indices, representing five domestic markets and four regional ones between January 2011 and March 2019 rebalancing only when the signal went in and out of its respective zone. The paper discusses the results for the FTSE Developed Market index and highlights specific periods to demonstrate the signal’s potential as an additional source of market-timing information.
In conclusion, by focusing on the purely behavioral aspect of risk (i.e., ambiguity-aversion), and using the observed change in well-established risk factors related to this condition, we may be able to quantify the supply and demand balance between risk-tolerant and risk-averse investors in the market. This balance, or rather the imbalance thereof, is what in turn determines the level of discount or premium for risk assets in the market. Although further refinements need to be evaluated, we believe that this metric can then be used as an additional market-timing indicator for investors. As of April 3rd, the US market is high on risk-tolerance, the level of which suggests it is still safe to buy, but something about the lack of risk-aversion says not.
[1] Conversely, we should be able to detect a rising risk-tolerance behavior from a diminishing ambiguity-aversion.
[2] “Flight-to-Quality and Asset Allocation in a Financial Crisis”, first published in 2009 and revised in 2013.


