

Exploiting Changes in Investor Sentiment to Drive Risk-Timing Decisions—and Enhanced Performance
In 2018, Qontigo introduced a market sentiment indicator called the ROOFTM Scores. The first version of this indicator used the returns from eight of the fundamental style factors in our risk models to determine investor preferences for risk-tolerant or risk-averse strategies. In 2019, we released a sector variant of the Style ROOF Scores, cleverly named Sector ROOF Scores. In this variant we first established the character of each of the GICS sectors as being either risk tolerant or risk averse, based on the sector portfolio’s exposures to the eight style factors in the Style ROOF methodology. Next, we determine investor preferences for risk-tolerant or risk-averse sectors by using the sector portfolio’s active returns. Both the Style ROOF and the Sector ROOF scores are used in our weekly ROOF Highlights, where we discuss changes in investor sentiment from the previous week.
Earlier this year, we introduced a methodology for constructing Risk-On and Risk-Off variants of the market portfolio using a combination of the Sector and Style ROOF Scores. These ROOF Market Portfolios can be constructed with any rebalancing frequency and on any days of the month since the ROOF Scores are published daily, and used by investors to quantify the rewards for risk taking in specific market environments of interest. In the methodology paper for their construction, a section on performance measurement compares both risk-on and risk-off portfolios to their underlying benchmarks during eight separate but volatile periods. The last period reviewed in that paper was the initial recovery immediately after the Covid-19 crash, from March 24 through to May 28, 2020.
In this note, we present updated results for the STOXX USA 500 version of our ROOF Market Portfolios. These portfolios include a Risk-On and a Risk-Off variant built directly from the ROOF Scores and constituents of the STOXX USA 500 benchmark portfolio, and rebalanced monthly (at month-end) using the as-of-then sector ROOF scores and exposures (i.e., no look-ahead bias). We will focus on the last 12 months, as this period had several turnarounds in sentiment. The three periods under review here are as follows:
- October 1, 2019 to February 19, 2020 – This period saw bullish sentiment dominate markets, as investors cheered the end of the US-China Trade war and the announcement by the Federal Reserve that it was halting interest rate increases for the moment.
- February 19 to March 23, 2020 – The Covid-19 crash.
- March 24 to September 30, 2020 – The post-Covid-19 rebound.
In each of the charts below, we plot the cumulative returns for the periods under review for the STOXX USA 500 (black line), as well as the Risk-On (blue line) and Risk-Off (green line) ROOF Market Portfolios. By construction, we would expect each of the sentiment-aware ROOF Market portfolios to outperform the benchmark during market environments aligned with their risk-taking character. The Risk-On portfolio should outperform during bull markets, and underperform during bear markets, and vice versa for the Risk-Off portfolio.
1) October 1, 2019 – February 19, 2020
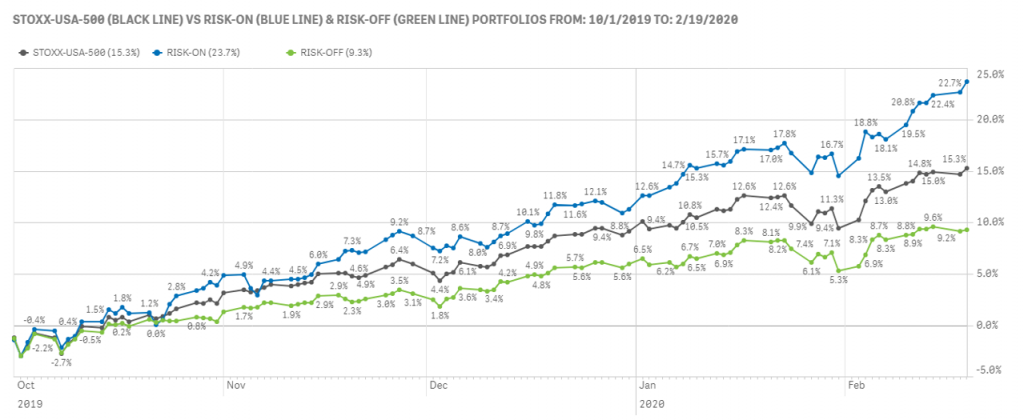
During this nearly five-month bull market, the Risk-On portfolio returned 23.7%, outperforming the STOXX USA 500 return of 15.3%. Conversely, the Risk-Off portfolio achieved a cumulative return of only 9.3% during the period, underperforming both the index and its more risk-tolerant counterpart. During that period, the reward for risk tolerance was 2.5 times that for risk aversion and 1.5 times that of the benchmark itself.
2) February 19 – March 23, 2020
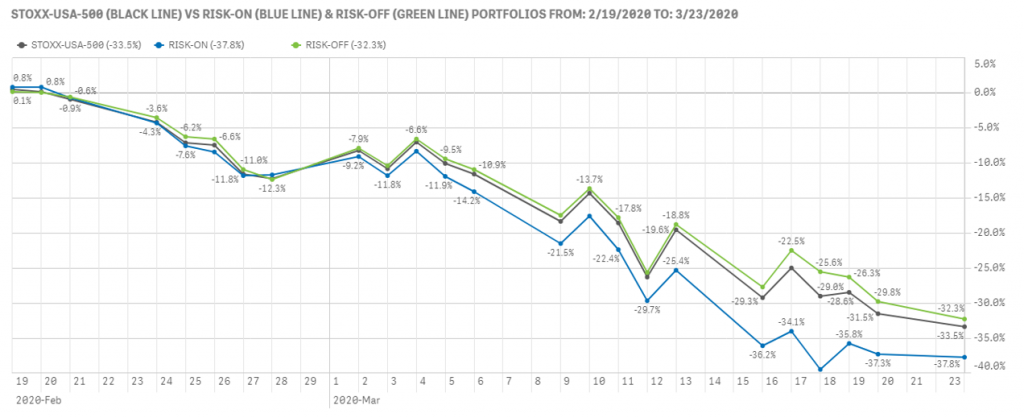
The Covid-19 crash of 2020 took place over just 21 days, but even during this short period, we saw the Risk-On portfolio underperform both the benchmark and its more risk-averse peer. During these 21 days, the value of the Risk-On portfolio fell by 37.8%, versus a 33.5% decline for the STOXX USA 500 index. The Risk-Off portfolio also fell during the crash, but fared better than both the index and the Risk-On portfolio, declining by ‘only’ 32.3%, besting both the index and the Risk-On portfolio.
3) March 24 – September 30, 2020
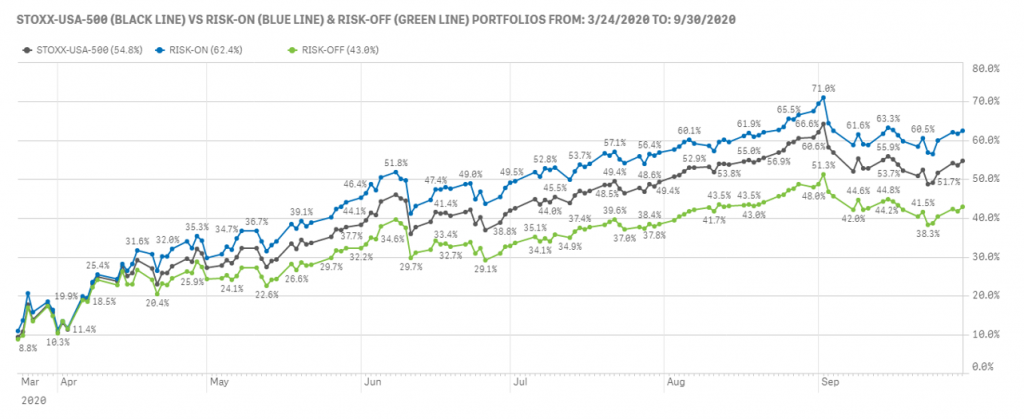
Spurred by massive monetary and fiscal stimulus packages, as well as the promise of more to come if necessary, sentiment quickly recovered and investors became bullish for the longest consecutive number of days in our ROOF Score history, which for the US market goes back to 1997. During the period of March 24 through September 30 of this year, the Risk-On portfolio returned a whopping 62.4%, outperforming the STOXX USA 500’s 54.8%. Conversely, the Risk-Off portfolio’s cumulative returns for the period were ‘only’ 43%, underperforming both the index and its risk-seeking counterpart. During this period, the reward for risk tolerance was 1.45 times bigger than for risk-aversion—in the middle of a once-in-a-century pandemic!
The ROOF Scores are a quantification of investors’ aggregate cognitive bias: are they bullish, bearish, or neutral? The same metrics used in their computation can also be used to construct sentiment-aware market portfolios to match an investor’s risk appetite or to track how risk is being rewarded in the market. We originally constructed these portfolios to validate the ROOF Score methodology, i.e., if we assigned each of the methodology’s style factor metrics correctly when defining risk tolerance or risk aversion, then the performance of the ROOF Market Portfolios should correspond with our intuition that risk-taking is rewarded in bullish times and punished in bearish times. The charts above show that the methodology worked quite well in the past 12 months. More to the point, these results illustrate how these tools can be applied to capitalize on shifting trends in investor sentiment.


