

The ROOF portfolios use sector and style ROOF Scores to construct sentiment-tracking portfolios designed to capture the returns from the implementation of a bullish or bearish strategy. In a difficult first half of the year, aligning portfolios with the overall negative sentiment in the market generated significant outperformance relative to ‘holding’ the entire market or ignoring the average investor’s outlook.
The ROOF portfolios are designed to measure the rewards (or losses) the market pays investors for risk-taking. At times, the market will reward investors who are more risk-tolerant than their average peers. At other times, it will compensate those who are more risk-averse. The portfolios are rebalanced at each month-end, to ensure they always represent the most current implementation of a bullish or bearish strategy. The methodology uses the latest ROOF Scores of each sector sub-portfolio to ensure a sector allocation that corresponds to the targeted strategy — that is, overweight risk-tolerant sectors and under-weight risk-averse ones in the risk-on portfolio, representative of a bullish strategy. The opposite applies to the risk-off portfolio.
Figure 1 shows the ROOF ratio (orange bars) for the US market, represented by the STOXX® USA 500 index, during the first six months of 2022. As we can see, sentiment was negative throughout the entire year-to-date period. In fact, it was negative (<0.0) 30% of the time and outright bearish (<-0.5) 70% of the time. Investors with a negative or bearish outlook tend to focus more on protecting their portfolio’s downside risk than on positioning them for leveraged upward potential. This will tend to drive the supply-and-demand balance in the market in favor of risk-averse assets and away from risk-tolerant ones.
Figure 1: STOXX USA 500 ROOF portfolios – YTD 2022
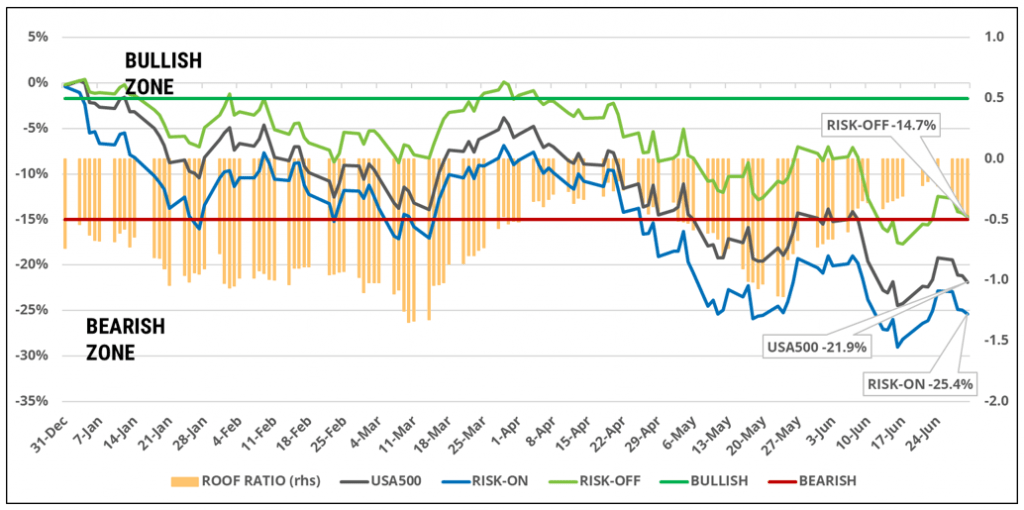
As per the ROOF methodology, the risk-off portfolio will overweight risk-averse assets while the risk-on portfolio will overweight the risk-tolerant ones. Figure 1 also shows the cumulative performance of the STOXX USA 500 parent index (black line), the risk-on portfolio (blue line), and the Risk-Off portfolio (green line).
The STOXX USA 500 index declined 22% from January 3 through June 30, 2022. The risk-off portfolio fell by ‘only’ 14.7% during that period, while the risk-on portfolio lost 25.4%. This means that in relative terms (i.e., active returns), the market ‘rewarded’ investors for constructing portfolios that were more risk-averse than the benchmark, and ‘punished’ those with the hubris of constructing more risk-tolerant portfolios.
Figure 2 displays the sector allocations of the three same portfolios (benchmark, risk-on and risk-off). These allocations are based on the respective sector ROOF Scores of each sector, which defines them as either risk-averse or risk-tolerant. In the construction methodology, constraints are used to ensure that the risk-on portfolio overweights the risk-tolerant sectors and underweights the risk-averse ones based on the ROOF Scores at the time of the rebalancing. The size of the over/underweights is driven by the strength of the sector ROOF Scores at rebalancing. The more positive the sector’s ROOF Score, the more overweight it will be in the risk-on portfolio, and the more underweight it will be in the risk-off portfolio.
Figure 2: Sector allocations – YTD 2022
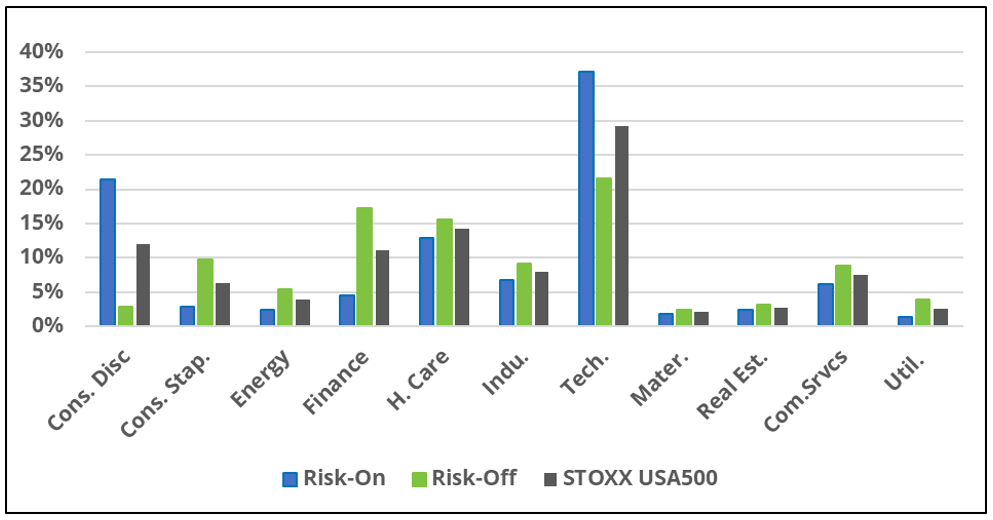
Additionally, the intra-sector stock selection is also subject to constraints so that each portfolio complies with the Style ROOF definitions for risk tolerance and risk aversion (see the Style ROOF methodology document for details). This ensures that both sector and stock-selection decisions are aligned with the portfolio’s investment thesis — bullish or bearish — during the portfolio construction process.
Both portfolios are constructed with an ex-ante active risk limit of 5%. The average ex-post active risk of the risk-off portfolio so far this year has been just 4.9%, and 5.36% for the risk-on portfolio. The average annualized two-way turnover across the five monthly rebalancings in the period was 21% for the risk-off and 48% for the risk-on portfolio.
The ROOF ratio, as an indicator of market sentiment, was consistently negative in the first half of 2022. Portfolios constructed in accordance with sentiment, loading on risk-averse assets during a ‘fear’ cycle, benefited from the increasing demand for defensive assets, which drove up their value during the period. Conversely, as investors rotated out of risk-tolerant assets that were no longer consistent with their negative or bearish outlook for markets, those assets declined in value under increasing supply and diminishing demand.
The influence of investors’ mood
Investor sentiment matters. The ROOF methodology was designed to define, quantify and monitor sentiment across multiple markets using observable investor preferences for both style factors and sector exposures. The ROOF portfolios were constructed from the ROOF Scores and allow investors to monitor how sentiment is priced in the market based on the supply and demand for risk. During the first six months of 2022, investor sentiment was very negative, and the ROOF portfolios captured the differential between strategies aligned with the general sentiment and contrarian ones. Year-to-date, investors who implemented a risk-tolerant strategy underperformed those who implemented a risk-averse strategy by more than 10%. This is significant over a six-month period.
Looking for timely updates on how investors are feeling about markets? Sign up here to get the latest ROOF Scores delivered to your inbox every Monday.


