

Investors in emerging markets are enduring yet another volatile ride. Stymied by rising interest rates in the US, shares in those developing nations most dependent on external financing have slumped.
The STOXX® Emerging Markets 1500 Index has lost 16% from its 2018 peak on Jan. 26, when measured in dollars.1 That’s not far from bear-market territory, a threshold usually defined as a retreat of 20% or more.
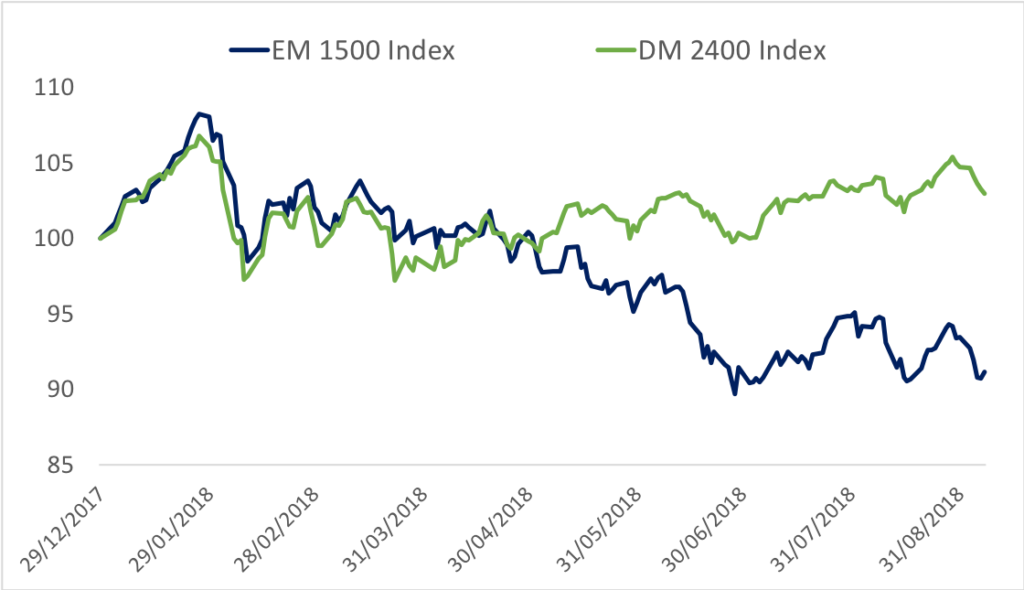
The index is now down 8.9% in 2018. While that’s a sizeable retreat, it would only mark the worst annual return since 2015. By contrast, the STOXX® Developed Markets 2400 Index is up 3% this year.
Chart 1 shows the comparison between the emerging-markets and developed-markets benchmarks. The latter has rebounded from its first-quarter losses, underpinned by buoyant US markets.
Investors should put the recent sell-off in context. This year’s losses amount to about two-thirds of those in calendar year 2015. And they come after a 48% total rally in the past two years. Moreover, there have been two bear markets for the Emerging Markets 1500 Index since 2011, and both were followed by sharp recoveries.
A universe of diverging economies
Yet while emerging markets are struggling as an asset class, country idiosyncrasies have played a role in performance. While contagion fears often drive investors to dump all emerging markets in tandem, local factors have this year helped some indices cushion the downtrend.
Table 1 shows the performance of the Total Market Indices in dollars for 20 emerging nations tracked by STOXX since Jan. 26 this year.
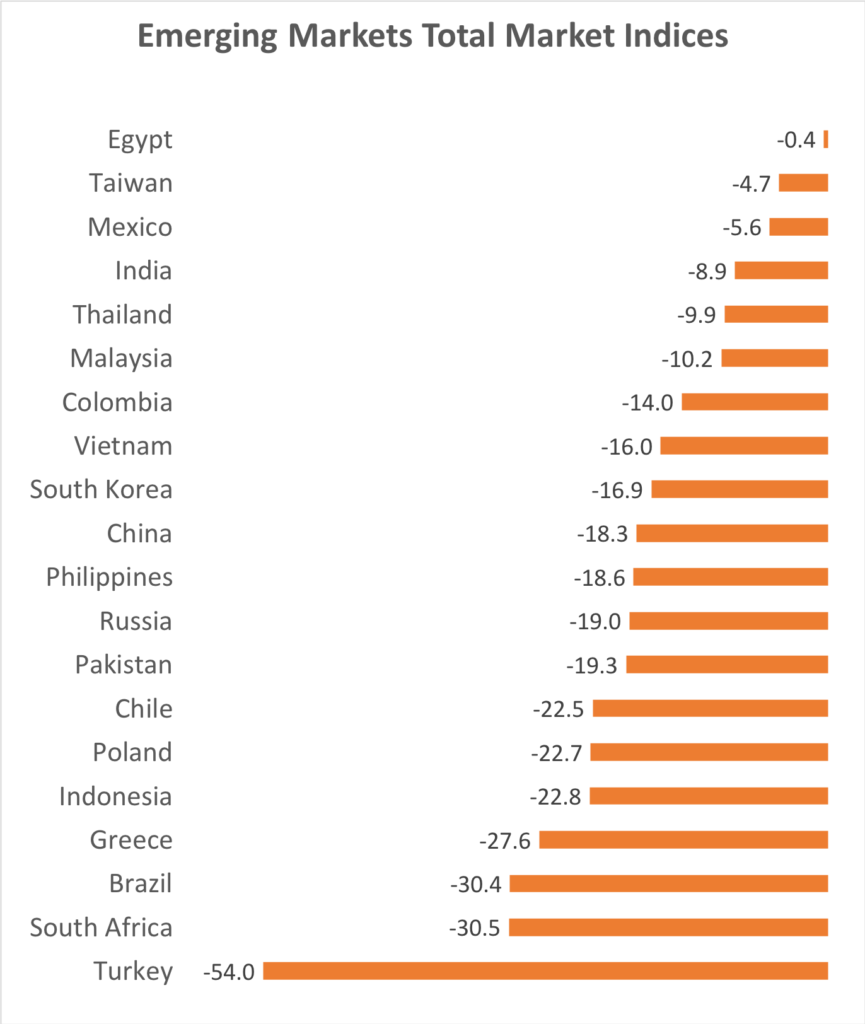
Generally speaking, investors have sold shares in countries with the largest budget deficits and higher debt burdens. Falling currencies have been a symbol of those problems, but they have also worsened the dollar-based returns of the national indices.
Turkey has been at the forefront of the market pullback, with the STOXX® Turkey Total Market Index falling 54% since January. Currency and equity traders have sold the country’s assets amid concern the government is failing to control runaway inflation.
Gains of more than 60% in the dollar against currencies such as the Turkish lira and the Argentine peso this year means those countries face a harder time servicing their dollar-denominated debt. The greenback has strengthened 23% this year against both South Africa’s rand and the Brazilian real.
Relative winners
At the other end, Egypt is benefiting from faster economic growth as the government reforms the economy and cuts subsidies. The Taiwanese benchmark has been supported by a record rally in its largest constituent, chipmaker Taiwan Semiconductor Manufacturing Co. (TSMC). The Mexican index has rebounded since June as the country and the US reached an agreement on reforming the NAFTA trade bloc.
A volatile asset class
To be sure, developing markets are a volatile asset class, and indeed have posted bigger losses even in the recent past. Between May 2011 and October that year, the STOXX Emerging Markets 1500 Index slumped 28%. And between April 2015 and January 2016, it plummeted 31%. In those instances, the index went on to rebound 39% and 80%, respectively, in following years.
The difference this time is that global monetary policy is increasingly less supportive of risky assets. What governments in the emerging world do to fend off the effect of rising borrowing costs may determine how national benchmarks progress in the remaining four months of the year.
Featured indices
1Total returns after taxes through Sep. 7.


