

The STOXX® Global 1800 Index extended its advance during December to post a second straight year of double-digit percentage gains, as investors raised expectations that policy support and vaccines will help economies overcome the COVID-19-induced slump.
The global index rose 4.3% in dollar terms to a record during December, including dividends, for a 16.9% jump in 2020.1 The benchmark added 2% in euros in the month as the greenback fell 2.3% against the common currency.
December’s performance showed a regional drift that was reflected as well throughout the year. The Eurozone’s EURO STOXX 50® Index rose 1.8% in the month when measured in euros, while the pan-European STOXX® Europe 600 Index climbed 2.6%. Both still posted a loss for the entire year. The STOXX® North America 600 Index rose 4% in dollars during December for a 21% advance in 2020 and the STOXX® USA 500 Index gained 4.1% and 22.1%, respectively. The STOXX® Asia/Pacific 600 Index increased 4.9% and 13.6% in dollars.
Jabs roll-out
December saw the start of vaccination programs in industrialized nations, bolstering hopes that the pandemic may be controlled in coming months even as contagions are creeping up across the globe. In the US, Congress approved a $900-billion relief package that included handing out cash to Americans and helping businesses to weather the economic downturn.
Exhibit 1 – 2020 returns
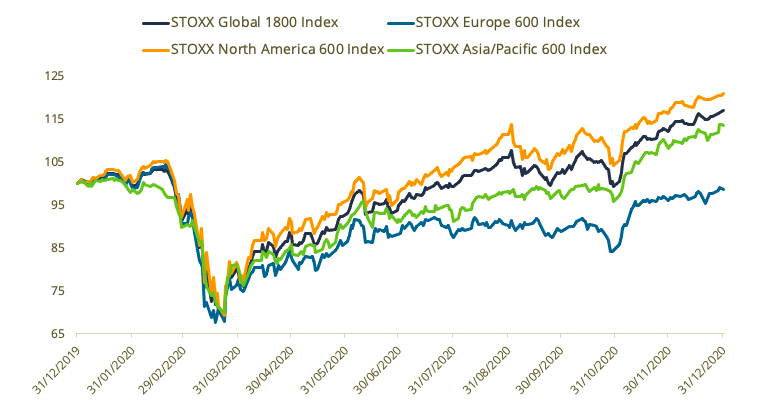
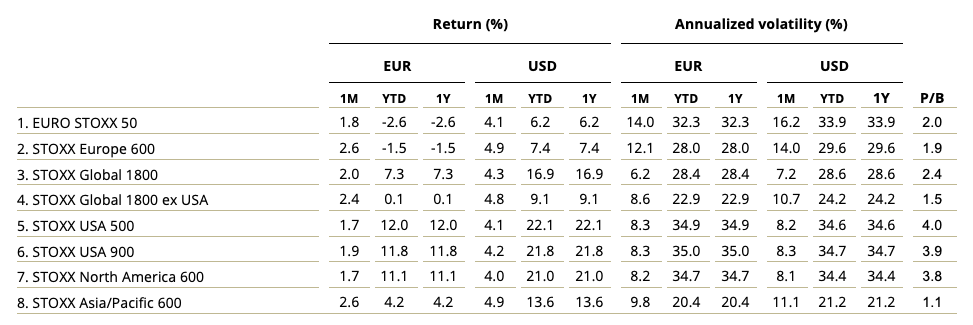
Exhibit 2 – Benchmark indices’ December risk and return characteristics
Despite December’s gains, the EURO STOXX 50® Volatility (VSTOXX®) Index ended the month at 23.4, higher than the 22.9 at the end of November. The volatility gauge, which tracks EURO STOXX 50 options prices, finished 2019 at 14. A higher reading suggests investors are paying up for puts that offer insurance against stock price drops.
Gains across all markets
All 25 developed markets tracked by STOXX advanced during December when measured in dollars. The STOXX® Luxembourg Total Market Index led returns for a second consecutive month, jumping 18.6%. The STOXX® Developed Markets 2400 Index rose 4.5% in dollars and 2.2% in euro terms. For the whole of 2020, it gained 17% and 7.4%, respectively.
Bullish sentiment lifted all but one of 21 national developing markets tracked by STOXX in the month. The STOXX® Egypt Total Market Index was the sole index to retreat, losing 1.2%. The STOXX® Emerging Markets 1500 Index gained 9.5% in dollars and 7% in euros in December, and climbed 11.9% and 2.7% respectively in 2020.
Autos up, energy down
All 20 Supersectors in the STOXX Global 1800 Index advanced in the month. The STOXX® Global 1800 Automobiles & Parts Index led gains both in December and for the entire year, adding 12.8% and 62.1%, respectively. The STOXX® Global 1800 Energy Index was the worst performer in 2020, losing 26.9%. It was followed by the banks gauge, which shed 10.4%.
Factor-based strategies
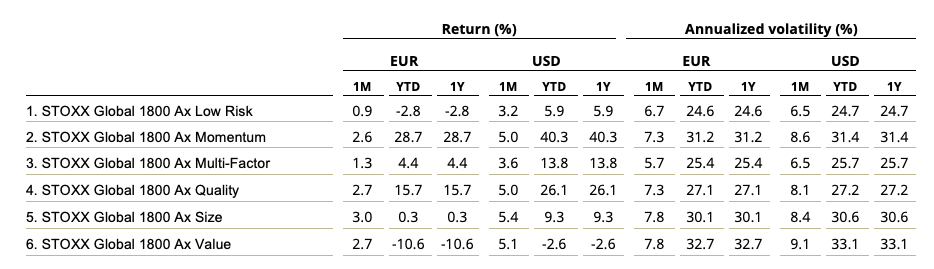
So-called value stocks were the year’s big losers when it came to factor investing, as investors favored businesses with high growth potential in the face of economic disruption. The STOXX® Global 1800 Ax Value Index fell 2.6% in 2020 even after jumping 5.1% in December.
That was far from the performance by Momentum and Quality stocks, which ruled this year among the STOXX Factor Indices covering global markets. The STOXX® Global 1800 Ax Momentum Index, for example, soared 40.3% in the year (Exhibit 3).
Exhibit 3 – STOXX Factor (Global) indices’ December risk and return characteristics
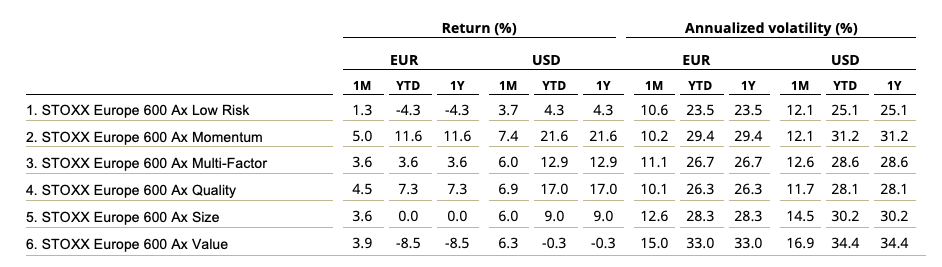
In Europe, the STOXX® Europe 600 Ax Momentum Index did better than all other factor indices during December, extending its 2020 edge. The STOXX® Europe 600 Ax Low Risk Index came out last in the group for a third month in a row and posted a loss for the entire year. (Exhibit 4).
Exhibit 4 – STOXX Factor (Europe) indices’ December risk and return characteristics
Momentum was also the strongest signal in 2020 in US factor portfolios. The STOXX® USA 500 Ax Momentum Index climbed 39.4% over the period.
Within the STOXX® ESG-X Factor Indices, the STOXX® Global 1800 ESG-X Ax Momentum Index jumped 41% in 2020. For December, it was the STOXX® Global 1800 ESG-X Ax Size Index that led gains, climbing 5.3%. The ESG-X Factor indices implement the same methodology of the STOXX Factor Indices, seeking exposure to five style signals, but do so on slightly smaller universes that exclude stocks based on the responsible polices of leading asset owners.
Factor Market Neutral Indices
Value was also the worst-performing strategy in 2020 within the iSTOXX® Europe Factor Market Neutral Indices, which hold a short position in STOXX Europe 600 futures to help investors neutralize systematic risk. The iSTOXX® Europe Value Factor Market Neutral Index slumped 15.9% on a net-return basis during the year.
All but two — Low Risk and Value — of the seven indices had a positive return during December, with the iSTOXX® Europe Size Factor Market Neutral Index coming up on top after adding 2.5%.
Minimum variance
Minimum variance strategies continued to underperform against December’s risk-taking background. The STOXX® Global 1800 Minimum Variance Index added 3.4% during the month and 8% for 2020. The STOXX® Global 1800 Minimum Variance Unconstrained Index rose 3.2% in December and 4.5% in the year. The STOXX® Europe 600 Minimum Variance Index climbed 2.1% in euros in December and fell 6.8% in 2020, while its unconstrained version increased 1.8% and slid 1.9%, respectively.
The STOXX® Minimum Variance Indices come in two versions. A constrained version has a similar exposure to its market-capitalization-weighted benchmark but with lower risk. The unconstrained iteration, on the other hand, has more freedom to fulfill its minimum variance mandate within the same universe of stocks.
Dividend strategies
In spite of a rebound in November and December, dividend strategies were overall very weak performers in the year that ended.
The STOXX® Global Maximum Dividend 40 Index rose 4.7% on a net-return basis in December, and only 0.1% in 2020.2 The index selects the highest-dividend-yielding stocks worldwide.
The STOXX® Global Select Dividend 100 Index, which tracks companies with sizeable dividends but also applies a quality filter such as a history of stable payments, rose 5% last month and 0.8% in the entire year. The index posted in November its strongest monthly gain since data begins in 2012.
The STOXX® Global Select 100 EUR Index, which blends increasing dividend yields with low volatility, slumped 19.5% in the year after being little changed in December.3
Sustainability indices
The major STOXX® ESG-X indices performed broadly in line with benchmarks during December, allowing investors to generate market-type returns while complying with sustainable policies. For the entire year, most of the indices beat their benchmarks.
The ESG-X indices are versions of traditional, market-capitalization-weighted benchmarks that observe standard responsible exclusions of leading asset owners.
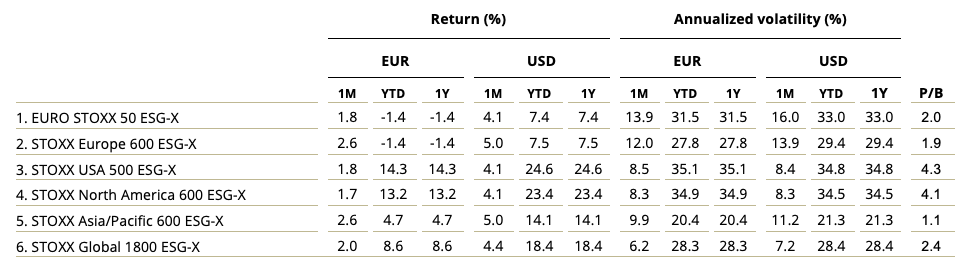
Exhibit 5 – STOXX ESG-X Indices’ December risk and return characteristics
Within indices that combine exclusions and ESG integration, the EURO STOXX 50® ESG Index underperformed its benchmark by 25 basis points during December. The ESG index, which is derived from the iconic EURO STOXX 50 Index, still beat its benchmark by more than 3 percentage points in 2020.
The DAX® 50 ESG Index, which excludes companies involved in controversial activities from a sustainability point of view and integrates ESG scoring into stock selection, rose 3% in December and 5.4% in 2020. That compares with respective gains of 3.2% and 3.5% for the flagship DAX®.
Climate benchmarks
Among STOXX’s climate indices, the STOXX® Europe Climate Impact Ex Global Compact Controversial Weapons & Tobacco Index and STOXX® Global Climate Impact Ex Global Compact Controversial Weapons & Tobacco Index trailed their respective benchmarks during December. They rose 1.7% in euros and 3.9% in dollars, respectively. For the whole of 2020, the Europe Climate Impact gauge shed 4.9% while the Global Climate Impact index rose 14.6%.
The STOXX Paris-Aligned Benchmark Indices (PABs) and the STOXX Climate Transition Benchmark Indices (CTBs) underperformed during December but outperformed when considering the whole 12 months. The indices were introduced last year and follow the requirements outlined by the European Commission’s Technical Expert Group (TEG) on climate benchmarks.
Thematic indices
The STOXX® Thematic Indices showed strong outperformance throughout the year as the strategies rightly captured the economic upside of disruptive global megatrends. The indices follow two approaches: revenue-based and artificial-intelligence-driven.
Nineteen of 22 revenue-based thematic indices outperformed the STOXX Global 1800 Index during 2020. The STOXX® Global Smart Cities Index was the best-performing gauge in the family last month (+11.8%) as well as for the entire year (+85.4%). The average 2020 gain for all 22 indices was 35%, more than double that of the STOXX Global 1800 benchmark. The STOXX® Global Broad Infrastructure Index was the weakest performer in the year, rising only 3%.
All three STOXX artificial-intelligence-driven thematic indices outperformed the benchmark STOXX Global 1800 in the month that ended, led by a 6.9% increase for the STOXX® AI Global Artificial Intelligence Index. The measure climbed 31.3% in 2020.
1 All results are total returns before taxes unless specified.
2 STOXX Maximum Dividend 40 Index is calculated in net returns.
3 This index is measured in euros.


