

Stocks fell in November, with indices reverting gains in the month’s last three sessions, as the emergence of the Omicron variant raised concerns the COVID-19 pandemic may continue to undermine the global economy.
The STOXX® Global 1800 Index fell 2.3% when measured in dollars and including dividends.1 The index gained 0.5% in euros as the greenback strengthened 2.7% against the common currency in the month. The benchmark is still up 16.2% in dollars this year.
The pan-European STOXX® Europe 600 Index lost 2.5% in euros from a record during the month, while the Eurozone’s EURO STOXX 50® Index decreased 4.3%.2 The STOXX® North America 600 Index slid 1.2% in dollars. The STOXX® Asia/Pacific 600 Index tumbled 4%.
Figure 1 – Benchmark indices’ November risk and return characteristics
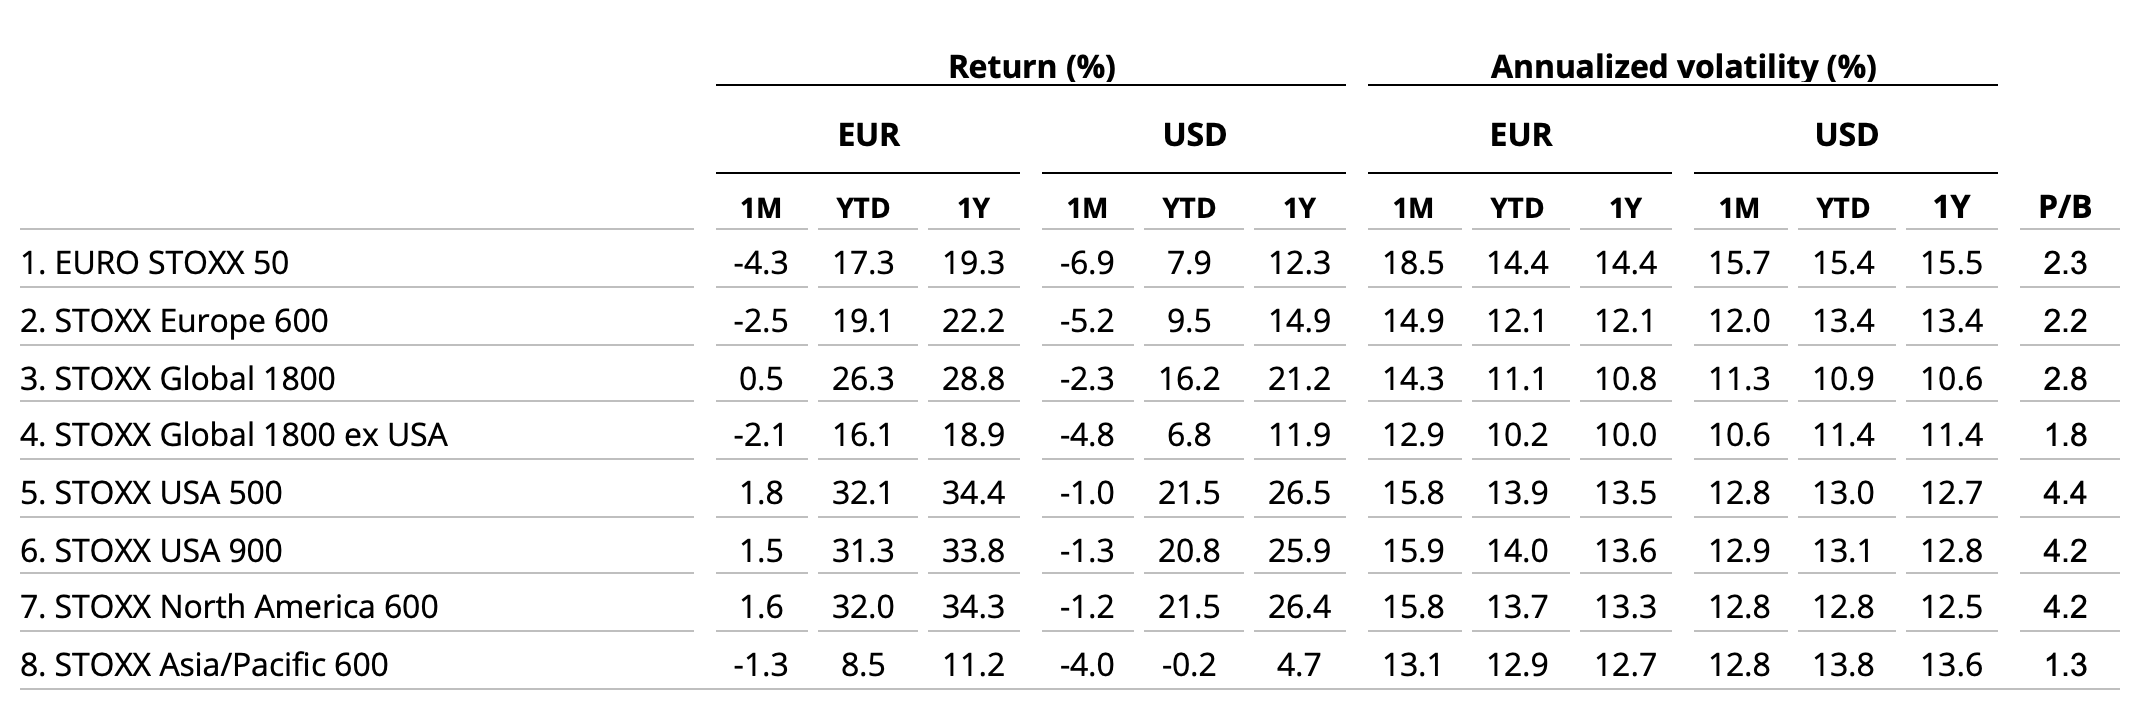
For a complete review of all indices’ performance last month, visit our November index newsletter.
The STOXX Global 1800 is headed for its ninth annual advance in the past ten years. The index has posted a yearly average gain of more than 13% over the period.
Figure 2 – Returns since January 1, 2020
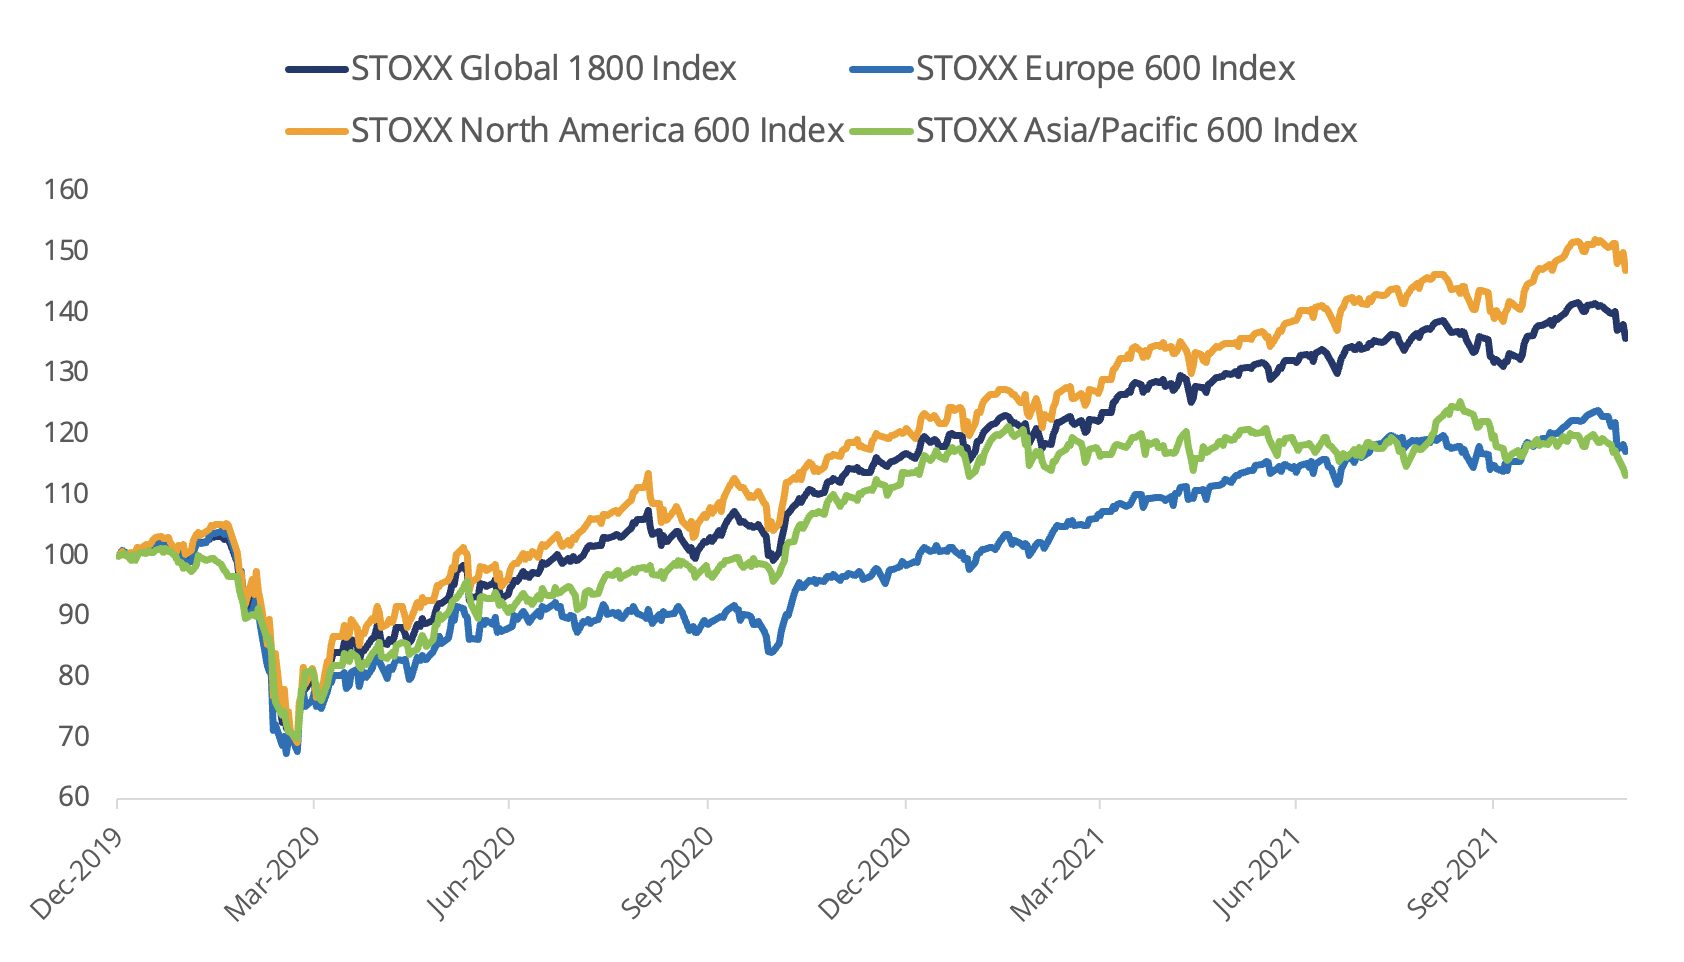
On November 26, the STOXX Global 1800 fell the most since September 2020 after South Africa reported the existence of a new variant of the COVID-19 virus, later named Omicron, which appears to have a higher infection risk than previous types. Markets fell heavily in 2020 as governments imposed restrictions to activity to contain the spread of the pandemic.
Volatility rises
The EURO STOXX 50® Volatility (VSTOXX®) Index, which tracks EURO STOXX 50 options prices, rose to 30.1 at the end of last month from 17.6 in October. A higher VSTOXX reading suggests investors are paying up for puts that offer insurance against stock price drops. The index climbed to 86 in March 2020 as countries restricted work and social activities.
Developed and emerging markets
All but one — Israel — of 25 developed markets tracked by STOXX fell during November when measured in dollars. The STOXX® Developed Markets 2400 Index dropped 2.5% in dollars but gained 0.3% in euros.
Sixteen of the 21 national developing markets fell in the month on a dollar basis. The STOXX® Emerging Markets 1500 Index slid 2.9% in the US currency and 0.1% in euros.
Travel & Leisure hit
All but two of 20 Supersectors in the STOXX Global 1800 declined in the month. The STOXX® Global 1800 Travel & Leisure Index (-8.7%)3 yielded the widest loss. At the other end, the STOXX® Global 1800 Technology Index gained 3%.
Size and Value factors post heavy losses
Most factor-based strategies provided outperformance relative to markets during November, according to the STOXX Factor Indices. Size and Value, however, posted wider losses than the benchmark.
Figure 3 – STOXX Factor (Global) indices’ November risk and return characteristics
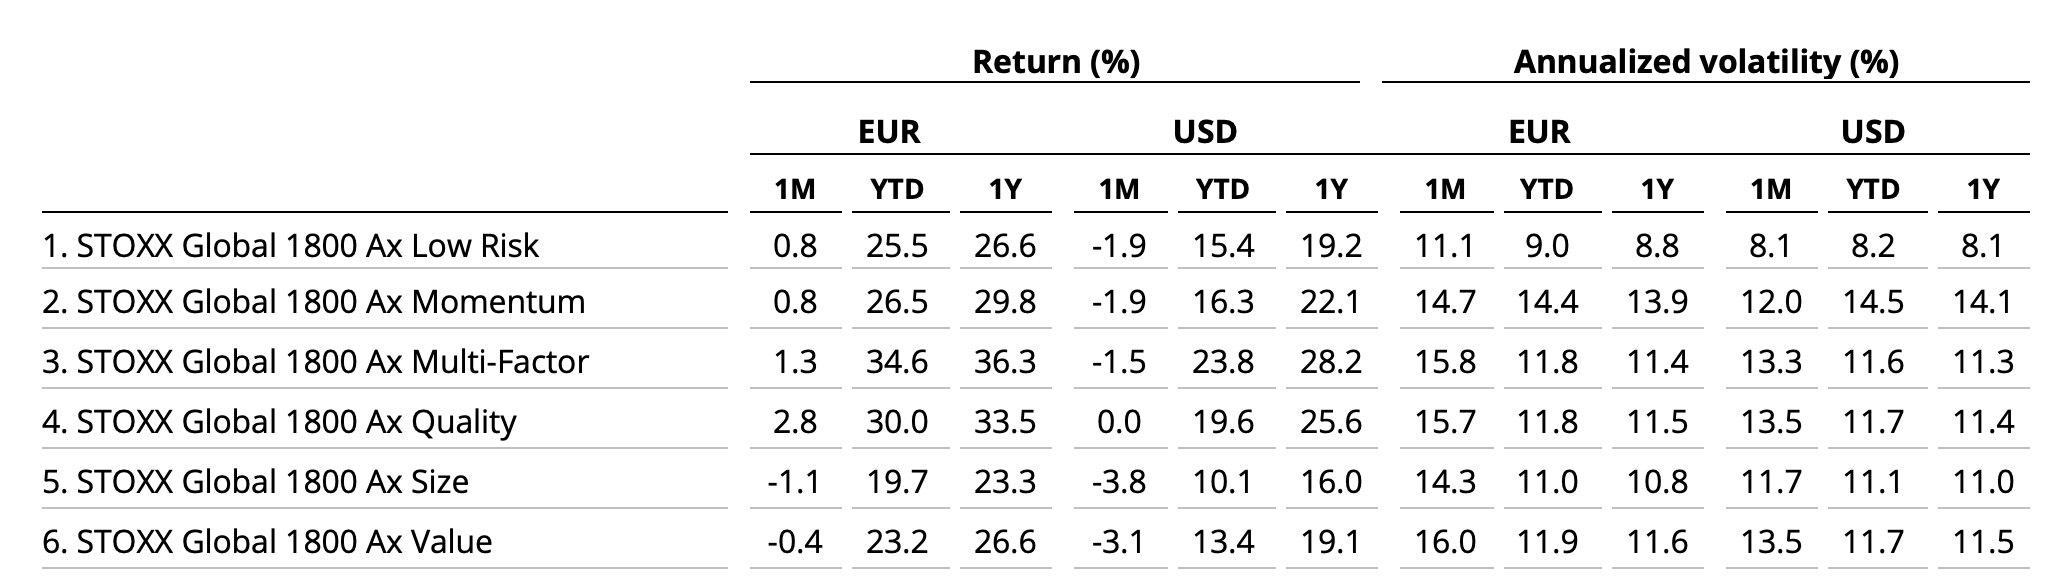
On a regional basis, the steepest losses within factor indices came from the STOXX® Europe 600 Ax Value Index (-4%) and STOXX® USA 900 Ax Value Index (-2.4%). In Asia/Pacific, the STOXX® Asia/Pacific 600 Ax Value Index and STOXX® Asia/Pacific 600 Ax Size Index both fell 4.9%.
ESG-X and ESG integration indices
The STOXX® Global 1800 ESG-X Index dropped 2.2%. The STOXX® ESG-X indices are versions of traditional, market-capitalization-weighted benchmarks that observe standard responsible exclusions of leading asset owners.
Within indices that combine exclusions and ESG integration, the EURO STOXX 50® ESG Index fell 3.4%. Germany’s DAX® 50 ESG Index (-3.7%), which excludes companies involved in controversial activities and integrates ESG scoring into stock selection, outperformed the benchmark DAX® (-3.8%) slightly.
Sustainability indices
Among other families in the STOXX sustainability index framework, the STOXX® Global 1800 ESG Broad Market Index dropped 2.1% in November. The STOXX ESG Broad Market Indices apply a set of compliance, product involvement and ESG performance exclusionary screens on a starting benchmark universe until only the 80% top ESG-rated constituents remain.
Next, the STOXX® Global 1800 ESG Target Index slid 2.2%, the EURO STOXX® ESG Target Index fell 2.7% and the DAX® ESG Target Index retreated 3.5%. The STOXX and DAX ESG Target Indices seek to significantly improve the benchmark portfolio’s ESG profile while mirroring its returns as closely as possible. The indices follow a similar initial selection methodology as the STOXX ESG Broad Market Indices. From that selection pool they implement, through a series of constraints, an optimization process to maximize the overall ESG score of the portfolio while constraining the tracking error to the benchmark.
Finally, the STOXX® Global 1800 SRI Index lost 0.6%. The STOXX SRI indices apply a rigorous set of carbon emission intensity, compliance and involvement screens, and track the best ESG performers in each industry group within a selection of STOXX benchmarks.
Climate benchmarks
There were good relative performances from the STOXX Paris-Aligned Benchmark Indices (PABs) and the STOXX Climate Transition Benchmark Indices (CTBs). The STOXX® Global 1800 PAB Index and the STOXX® Global 1800 CTB Index fell 1.3% and 1.6%, respectively. The indices were introduced last year and follow the requirements outlined by the European Commission’s Technical Expert Group (TEG) on climate benchmarks.
The STOXX® Willis Towers Watson World Climate Transition Index dropped 1.9% in November. The STOXX Willis Towers Watson Climate Transition Indices (CTIs) were introduced in October this year. They employ a unique Climate Transition Value at Risk (CTVaR) methodology that quantifies the anticipated impact of an economic transition on equity valuations. The CTIs look beyond carbon emissions and make a forward-looking, bottom-up evaluation of asset repricing risks in a decarbonization pathway.
Among the STOXX Low Carbon Indices, the EURO STOXX 50® Low Carbon Index (-4.7%) trailed the EURO STOXX 50 by 40 basis points in the month. Elsewhere, the STOXX® Global Climate Change Leaders Index (-2.7%), which selects corporate leaders that are publicly committed to reducing their carbon footprint, returned 44 basis points less than the STOXX Global 1800 Index.
Thematic indices
The STOXX® Thematic Indices had mixed performances last month. The indices seek exposure to the economic upside of disruptive global megatrends and follow two approaches: revenue-based and artificial-intelligence-driven.
Eleven of 22 revenue-based thematic indices beat the STOXX Global 1800 Index during November. The STOXX® Global Smart Factory Index was the month’s best performer after adding 5.3%. The STOXX®Global Sharing Economy Index lost 8.7%.
Among the STOXX artificial-intelligence-driven thematic indices, the STOXX® AI Global Artificial Intelligence Index dropped 2%.
Dividend strategies
Dividend strategies also suffered in the month that ended. The STOXX® Global Maximum Dividend 40 Index (-6.4%) selects only the highest-dividend-yielding stocks. The STOXX® Global Select Dividend 100 Index (-3.1%), meanwhile, tracks companies with sizeable dividends but also applies a quality filter such as a history of stable payments.
Minimum variance
Minimum variance strategies had strong returns in European markets relative to the benchmark. The STOXX® Europe 600 Minimum Variance Index fell only 0.2%, while its unconstrained version declined 0.4%.
The STOXX Minimum Variance Indices come in two versions. A constrained version has similar exposure to its market-capitalization-weighted benchmark but with lower risk. The unconstrained version, on the other hand, has more freedom to fulfill its minimum variance mandate within the same universe of stocks.
1 All results are total returns before taxes unless specified.
2 Throughout the article, all European indices are quoted in euros, while global, North America, US, Japan and Asia/Pacific indices are in dollars.
3 Figures in parentheses show last month’s gross returns.


