

Stocks declined in December, wrapping the STOXX® Global 1800 index’s worst year since the global financial crisis in 2008, as investor concerns lingered about the impact of inflation and higher interest rates on economic and earnings growth.
The global benchmark retreated 3.9% last month when measured in dollars and including dividends1, taking its 2022 loss to 17.9%. The index fell 7.3% in euros in December after the greenback slid 3.7% against the common currency.
The pan-European STOXX® Europe 600 decreased 3.4% in euros in the month and the Eurozone’s EURO STOXX 50® fell 4.3%. The STOXX® North America 600 declined 5.8% in dollars, as did the STOXX® USA 5002. The STOXX® Asia/Pacific 600 gained 0.7% in dollars.
Figure 1: Benchmark indices’ December risk and return characteristics
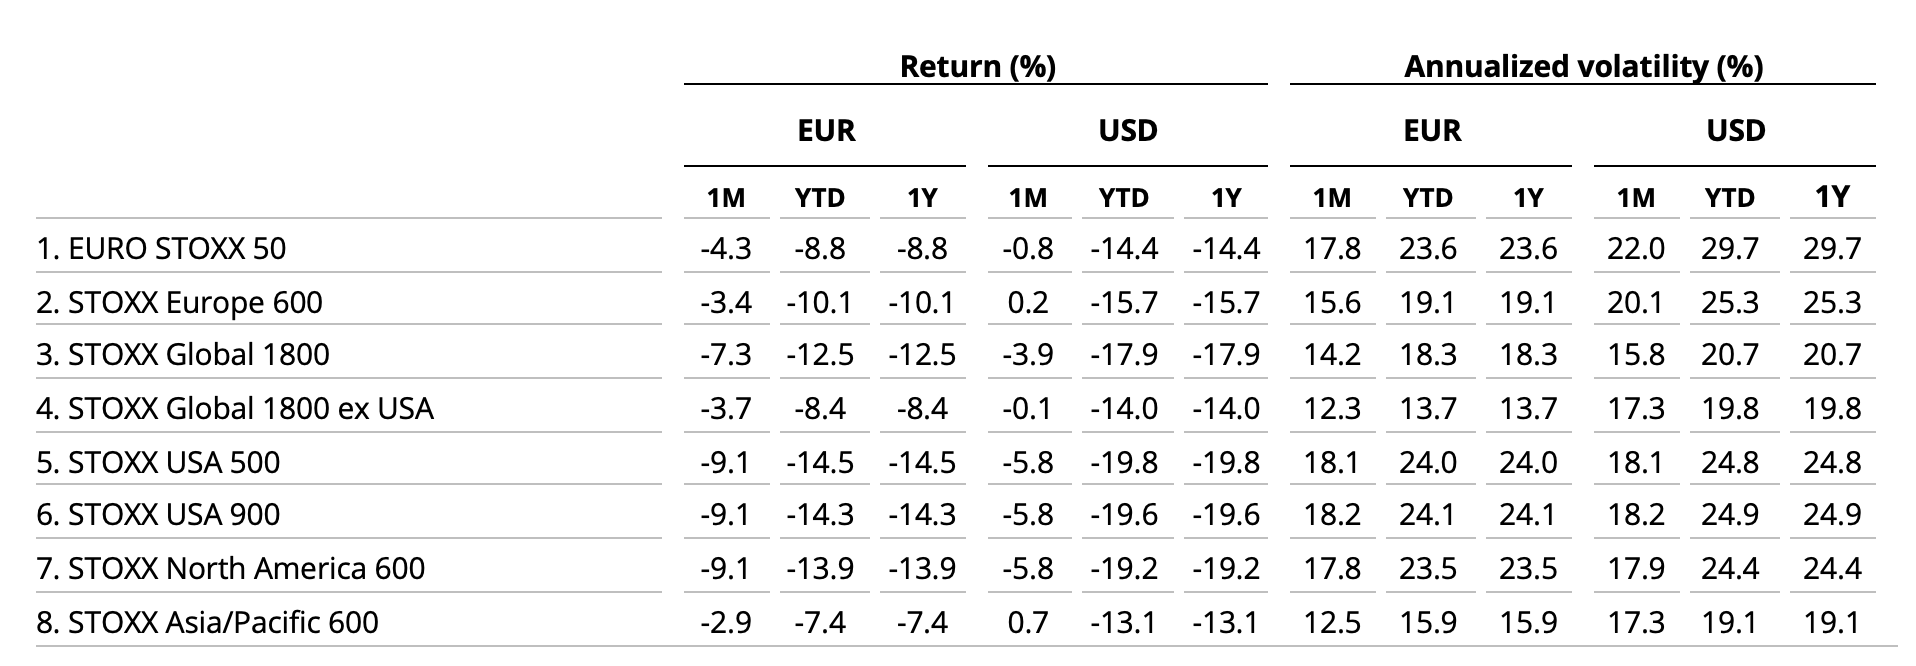
Germany’s DAX® dropped 3.3% in the month. MDAX®, which gauges the performance of German mid-caps, fell 1.9%.
Aggressive Fed sets risk-averse tone
2022 was the year when central banks put an end to loose monetary policy amid a record surge in inflation. The Federal Reserve raised the cost of borrowing in 2022 from close to zero to near 4.5%, one of its most aggressive hikes in history, pushing capital flows away from the riskiest assets. Investors also had to contend with the prospect of a recession in the US, a war in Europe and prolonged constraints to the global supply chain.
| For a complete review of all indices’ performance last month, visit our December index newsletter. |
Figure 2: Annual % returns for STOXX Global 1800 index
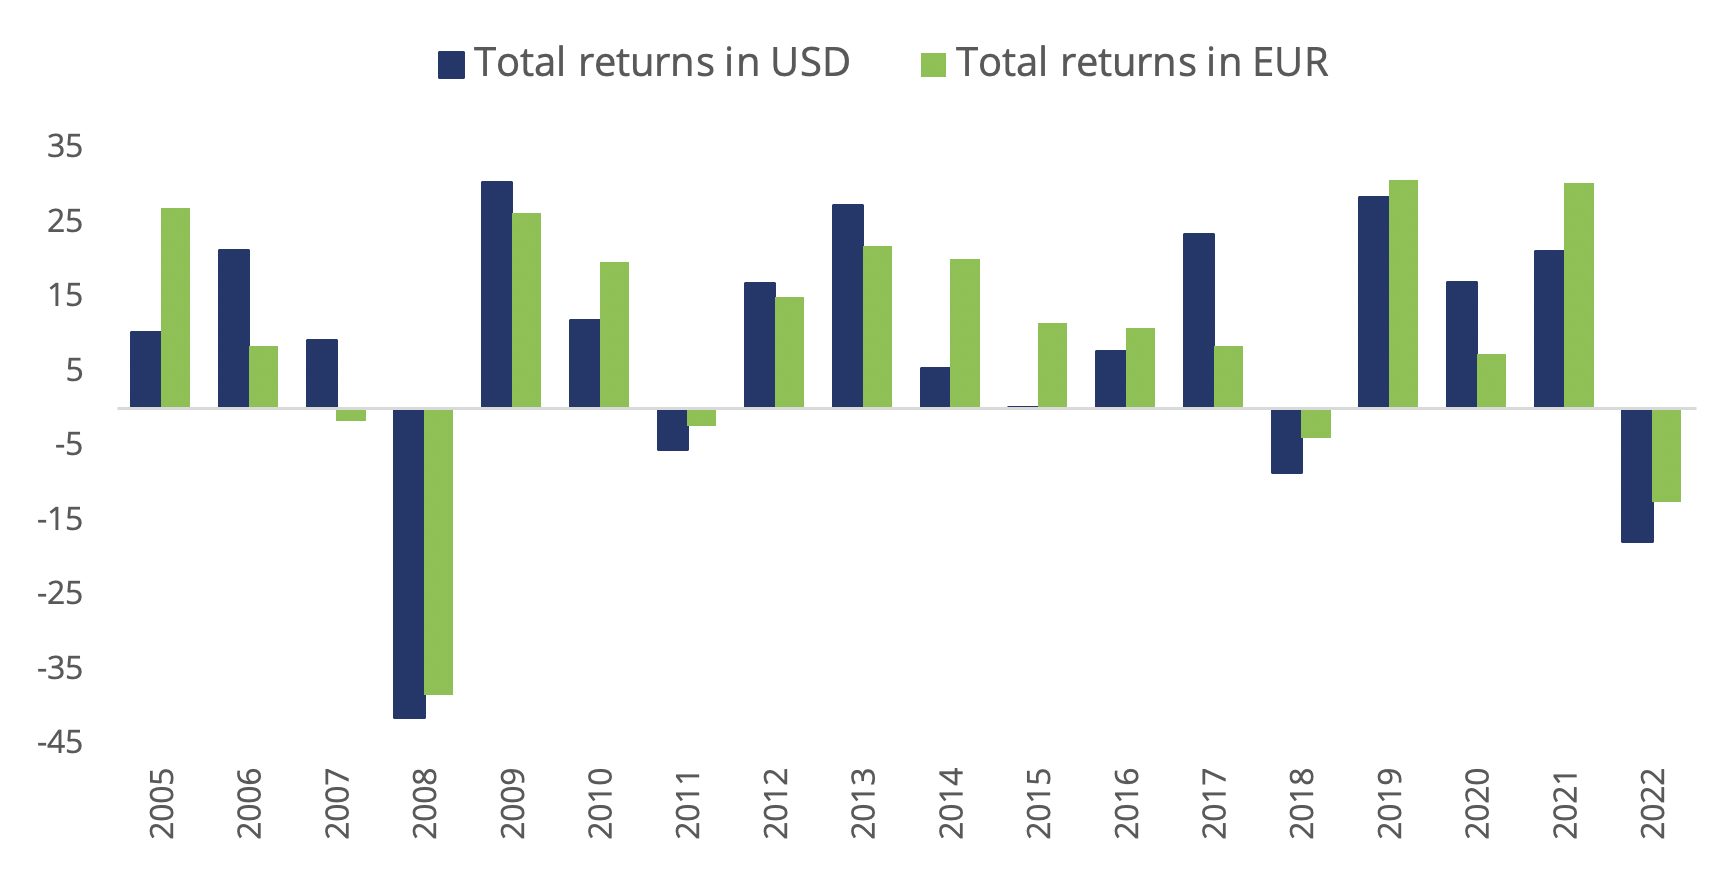
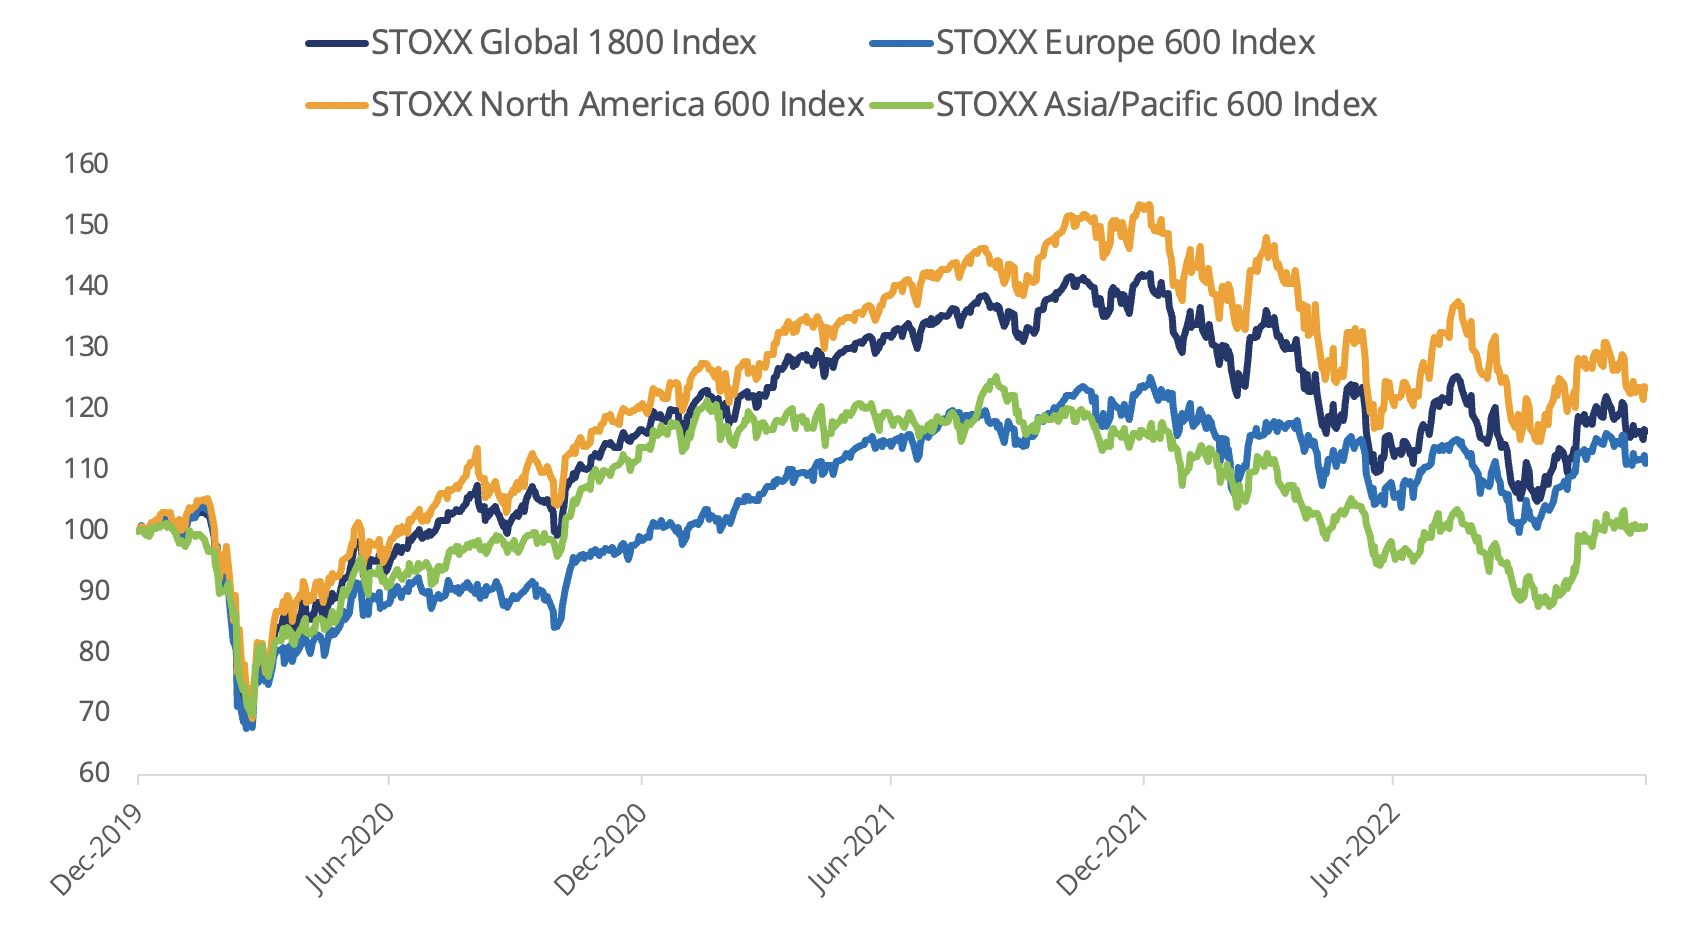
Figure 3: Returns since January 1, 2020
Volatility drops
The EURO STOXX 50® Volatility (VSTOXX®), which tracks EURO STOXX 50 options prices, slipped to 20.9 at the end of last month from 21.2 in November. A higher VSTOXX reading suggests investors are paying up for puts that offer insurance against stock price drops. The VDAX-New®, which measures volatility in German equities, fell to 20.6 from 21.7 in November.
Autos lead losses for third straight month
All but two of 20 Supersectors in the STOXX Global 1800 — Insurance and Utilities — had a negative return in the month. For a third month in a row, the STOXX® Global 1800 Automobiles & Parts was the worst performer. The index tumbled 18.6% last month, paced by Tesla Inc. shares, and also led losses for 2022 following a 45.6% retreat.
At the other end, the STOXX® Global 1800 Energy index was the best performer in the year among the 20 Supersectors, jumping 43.8%.
Fourteen of 25 developed markets tracked by STOXX advanced in December when measured in dollars, while only two countries — Singapore and Portugal — had a positive return for the entire year. The STOXX® Developed Markets 2400 index fell 4.1% in dollars in December and 17.9% in 2022.
Eleven of 20 national developing markets tracked by STOXX rose in the month on a dollar basis, while seven etched a gain for the whole of 2022. The STOXX® Emerging Markets 1500 index lost 3% in the US currency in December and 18.5% for the year.
Factor investing
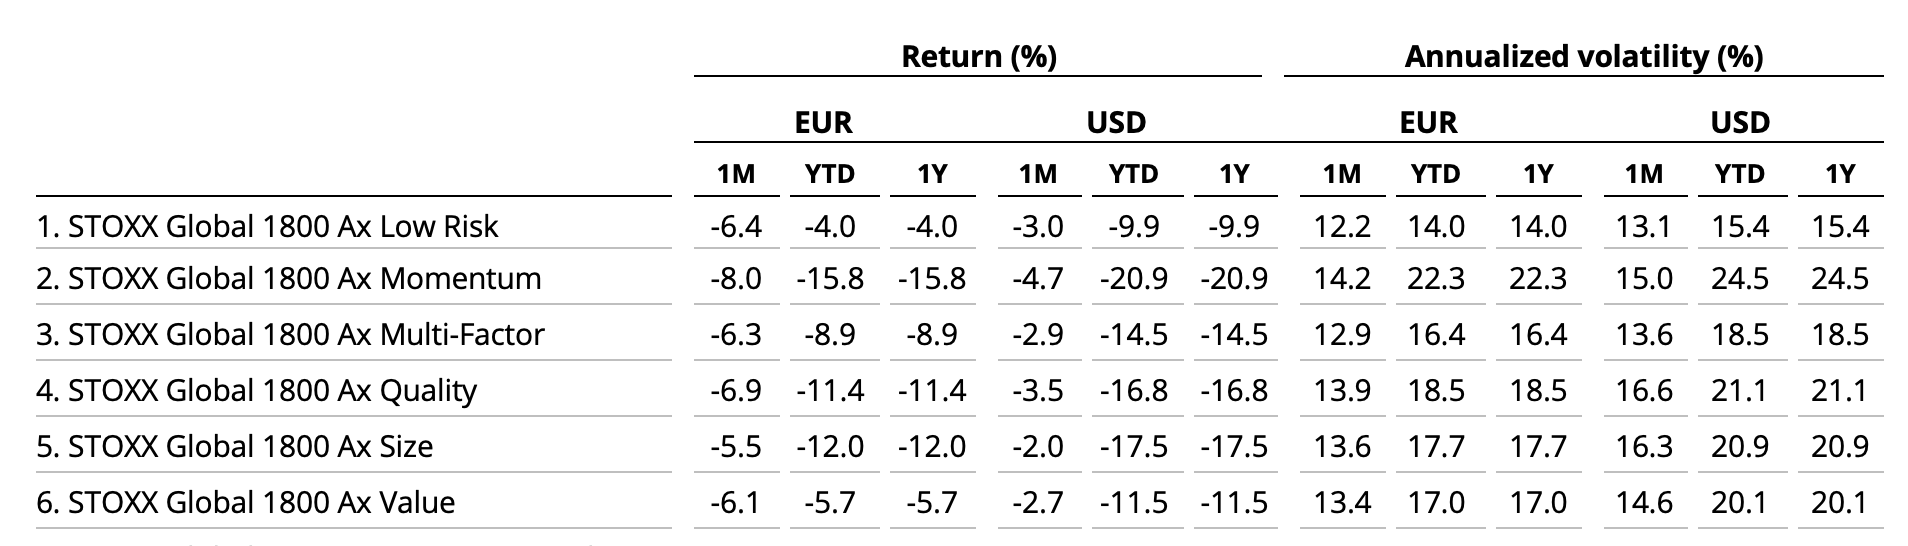
Momentum was the worst-performing style in the month that ended, finishing its worst year since 2008, according to the STOXX Factor indices.
Figure 4: STOXX Factor (Global) indices’ December risk and return characteristics
Climate benchmarks
Among climate benchmarks, the STOXX® Global 1800 Paris-Aligned Benchmark (PAB) and the STOXX® Global 1800 Climate Transition Benchmark (CTB) fell 4.3% and 4.2%, respectively, in December. The PAB and CTB indices follow the requirements outlined by the European Commission’s climate benchmarks regulation.
The STOXX® Willis Towers Watson World Climate Transition Index slid 4.3% in the month. The STOXX Willis Towers Watson Climate Transition Indices (CTIs) employ a unique Climate Transition Value at Risk (CTVaR) methodology that quantifies the anticipated impact of an economic transition on equity valuations. The CTIs look beyond carbon emissions and make a forward-looking, bottom-up evaluation of asset repricing risks in a decarbonization pathway.
Among the STOXX Low Carbon indices, the EURO STOXX 50® Low Carbon (-4%)3 outperformed the EURO STOXX 50 by 24 basis points in December. Elsewhere, the STOXX® Global Climate Change Leaders (-2.4%), which selects corporate leaders that are publicly committed to reducing their carbon footprint, outperformed the STOXX Global 1800 index by 151 basis points last month.
Sustainability indices
The STOXX® Global 1800 ESG-X index dropped 4% in the month. The STOXX® ESG-X indices are versions of traditional, market-capitalization-weighted benchmarks that observe standard responsible exclusions.
Within indices that combine exclusions and ESG best-in-class integration, the EURO STOXX 50® ESG index fell 4.3% in December. Germany’s DAX® 50 ESG index (-3.6%), which excludes companies involved in controversial activities and integrates ESG scoring into stock selection, underperformed the benchmark DAX.
Among other STOXX sustainability families, the STOXX® Global 1800 ESG Broad Market index fell 4.2% in the month. The STOXX ESG Broad Market indices apply a set of compliance, product involvement and ESG performance exclusionary screens on a starting benchmark universe until only the 80% top ESG-rated constituents remain.
The STOXX® Global 1800 ESG Target shed 4.1%, the EURO STOXX® ESG Target lost 3.8% and the DAX® ESG Target fell 3.6%. The STOXX and DAX ESG Target indices seek to significantly improve the benchmark portfolio’s ESG profile while mirroring its returns as closely as possible. Through a series of constraints, the indices implement an optimization process to maximize the overall ESG score of the portfolio while limiting the tracking error to the benchmark.
The STOXX® Global 1800 SRI fell 3.1%. The STOXX SRI indices apply a rigorous set of carbon emission intensity, compliance and involvement screens, and track the best ESG performers in each industry group within a selection of STOXX benchmarks.
Finally, the DAX® ESG Screened lost 3.7% in the month. The index reflects the composition of the DAX benchmark minus companies that fail to pass norms-based and controversial weapons screenings, meet minimum ESG ratings or are involved in certain business activities considered undesirable from a responsible investing perspective.
Thematic indices
It was a difficult year for the STOXX® Thematic indices, as was December. Among 25 STOXX thematic indices, 17 underperformed the benchmark STOXX Global 1800 last month, while 21 trailed for the entire year. The STOXX® Global Health & Weight Loss index was the only one in the suite to post a positive return last month.
Dividend strategies
Most dividend strategies had a positive return last month, capping a relatively good year vis-à-vis benchmarks. The STOXX® Global Maximum Dividend 40 (1.6%) selects only the highest-dividend-yielding stocks. The index fell 2.3% in the year. The STOXX® Global Select Dividend 100 (0.2%) tracks companies with sizeable dividends but also applies a quality filter such as a history of stable payments. It lost 7.1% in 2022.
Minimum variance
Minimum variance strategies outperformed benchmarks last month. The STOXX® Global 1800 Minimum Variance fell 2.9% and the STOXX® Global 1800 Minimum Variance Unconstrained rose 1.1%.
The STOXX Minimum Variance Indices come in two versions. A constrained version has similar exposure to its market-capitalization-weighted benchmark but with lower risk. The unconstrained version, on the other hand, has more freedom to fulfill its minimum variance mandate within the same universe of stocks.
1 All results are total returns before taxes unless specified.
2 Throughout the article, all European indices are quoted in euros, while global, North America, US, Japan and Asia/Pacific indices are in dollars.
3 Figures in parentheses show last month’s gross returns.


