

Stocks jumped in January as expectations built up that inflation worldwide may have peaked and that any recession in key developed economies may be mild.
The STOXX® Global 1800 index rose 7% last month when measured in dollars and including dividends1. The global benchmark slid 17.9% in 2022, its worst year since 2008, as central banks pressed ahead with interest rate hikes to combat runaway inflation. The index added 5.1% in euros in January after the greenback slid 1.8% against the common currency.
The Eurozone’s EURO STOXX 50® jumped 9.9% in euros in the month, the best performance in ten months, and the pan-European STOXX® Europe 600 increased 6.8%.2 The STOXX® North America 600 added 6.5% in dollars, while the STOXX® USA 500 rose 6.4%. The STOXX® Asia/Pacific 600 gained 6.8% in dollars.
Figure 1: Benchmark indices’ January risk and return characteristics
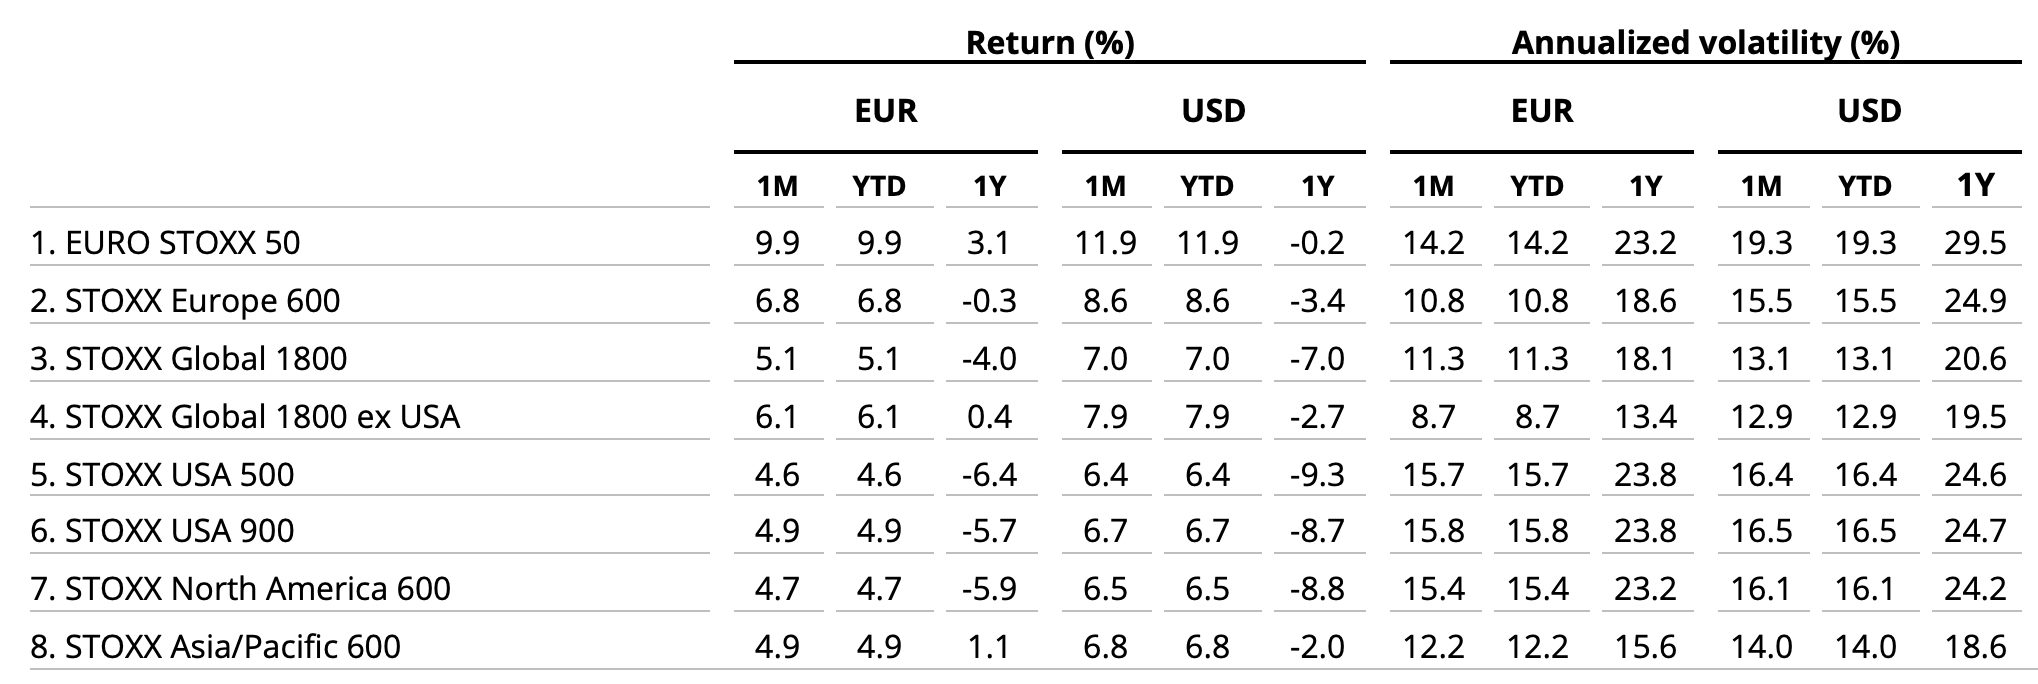
Germany’s DAX® rose 3.3% in the month. MDAX®, which gauges the performance of German mid-caps, surged 14.7%.
| For a complete review of all indices’ performance last month, visit our January index newsletter. |
A more benign outlook
The U.S. Consumer Price Index (CPI) dropped in December for the first time since May 2020 and the annual rate of inflation slowed to 6.5% from 7.1% in November, the sixth straight month of declines, the Bureau of Labor Statistics said Jan. 12. As inflation appears to be cooling from multi-year highs, investors are raising bets the Federal Reserve may soon pause its series of interest-rate increases. Meanwhile, a warmer-than-usual winter in Europe and continued fiscal support has prompted economists to upgrade their growth forecasts for the region.
Figure 2: Annual % returns for STOXX Global 1800 index
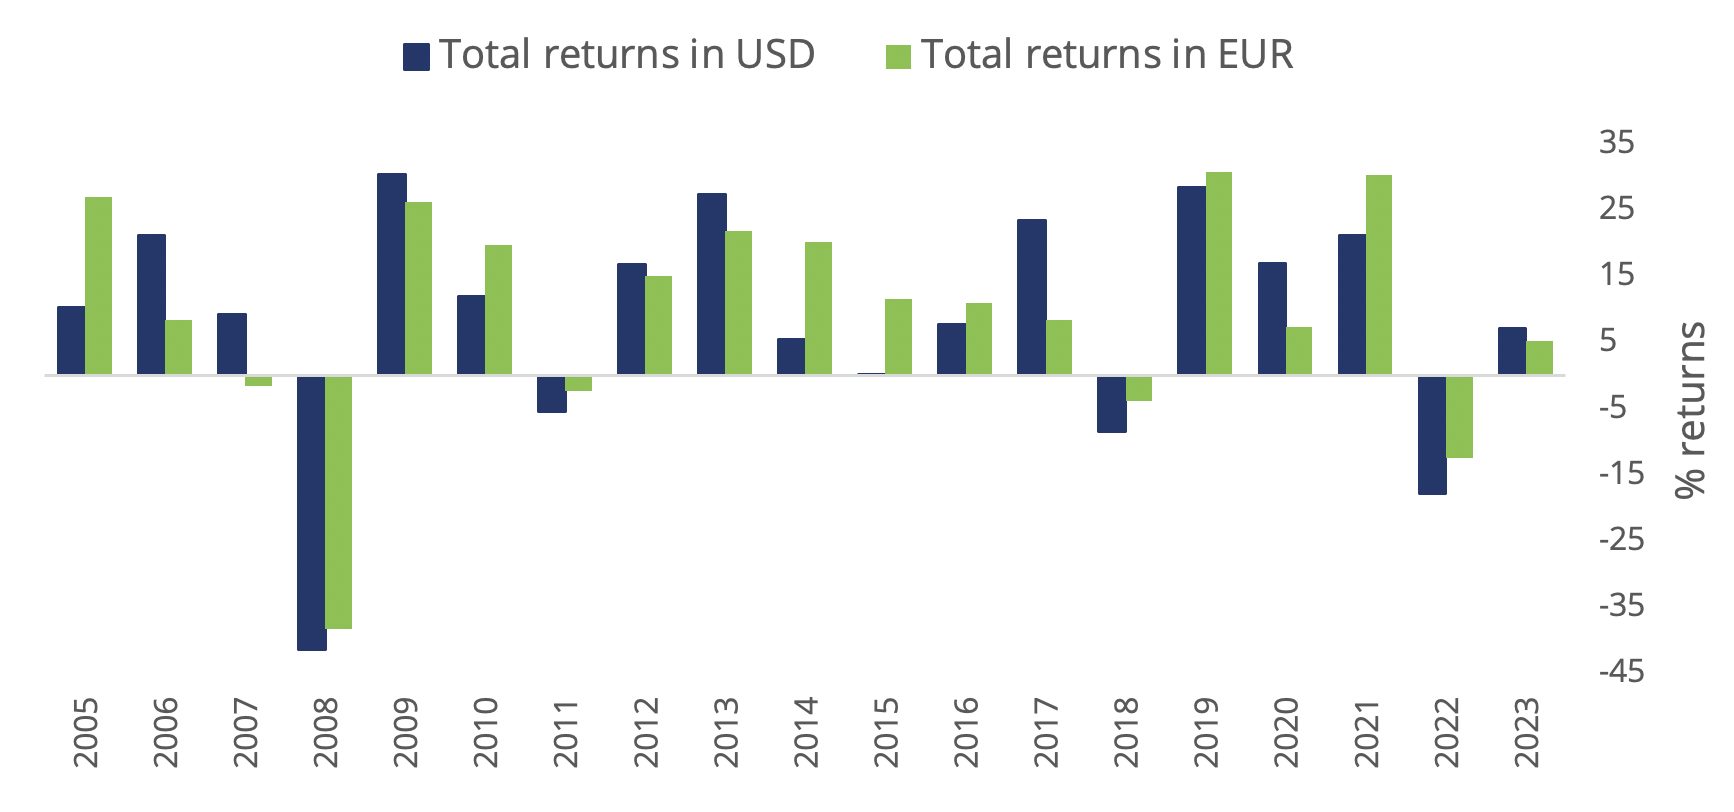
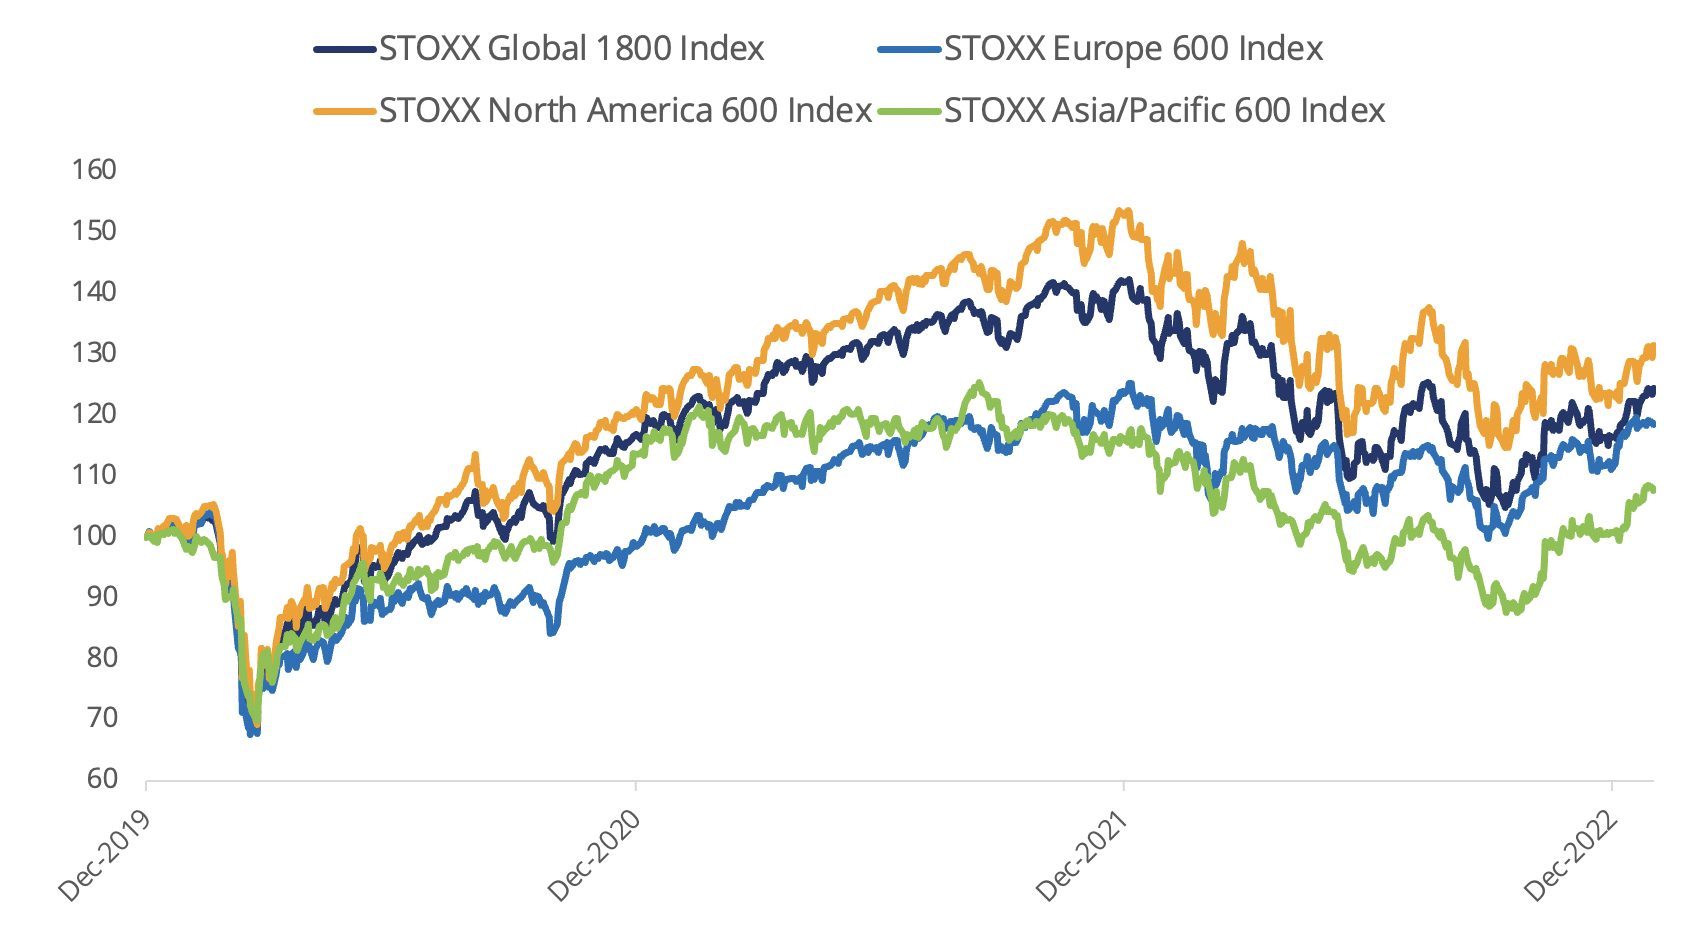
Figure 3: Returns since Jan. 1, 2020
Volatility drops
The EURO STOXX 50® Volatility (VSTOXX®), which tracks EURO STOXX 50 options prices, slipped to 18.6 at the end of last month from 20.9 in December. A higher VSTOXX reading suggests investors are paying up for puts that offer insurance against stock price drops. The VDAX-New®, which measures volatility in German equities, also fell to 18.6, from 20.6 in December.
Autos rebound
After leading losses for three consecutive months among 20 Supersectors in the STOXX Global 1800, the STOXX® Global 1800 Automobiles & Parts came out on top in January with a 19.4% advance. The automobiles index had the worst performance of all Supersectors in 2022 following a 45.6% retreat, paced by Tesla Inc. shares.
At the other end of the table, the STOXX® Global 1800 Personal Care Drug and Grocery Stores index lost 1.1% in January.
All but one of 25 developed markets tracked by STOXX advanced in January when measured in dollars, with Norway being the exception. The STOXX® Developed Markets 2400 index rose 7.2% in dollars in and 5.4% in euros.
Sixteen of 20 national developing markets tracked by STOXX rose in the month on a dollar basis. The STOXX® Emerging Markets 1500 index added 6% in the US currency and 4.1% in euros.
Factor investing
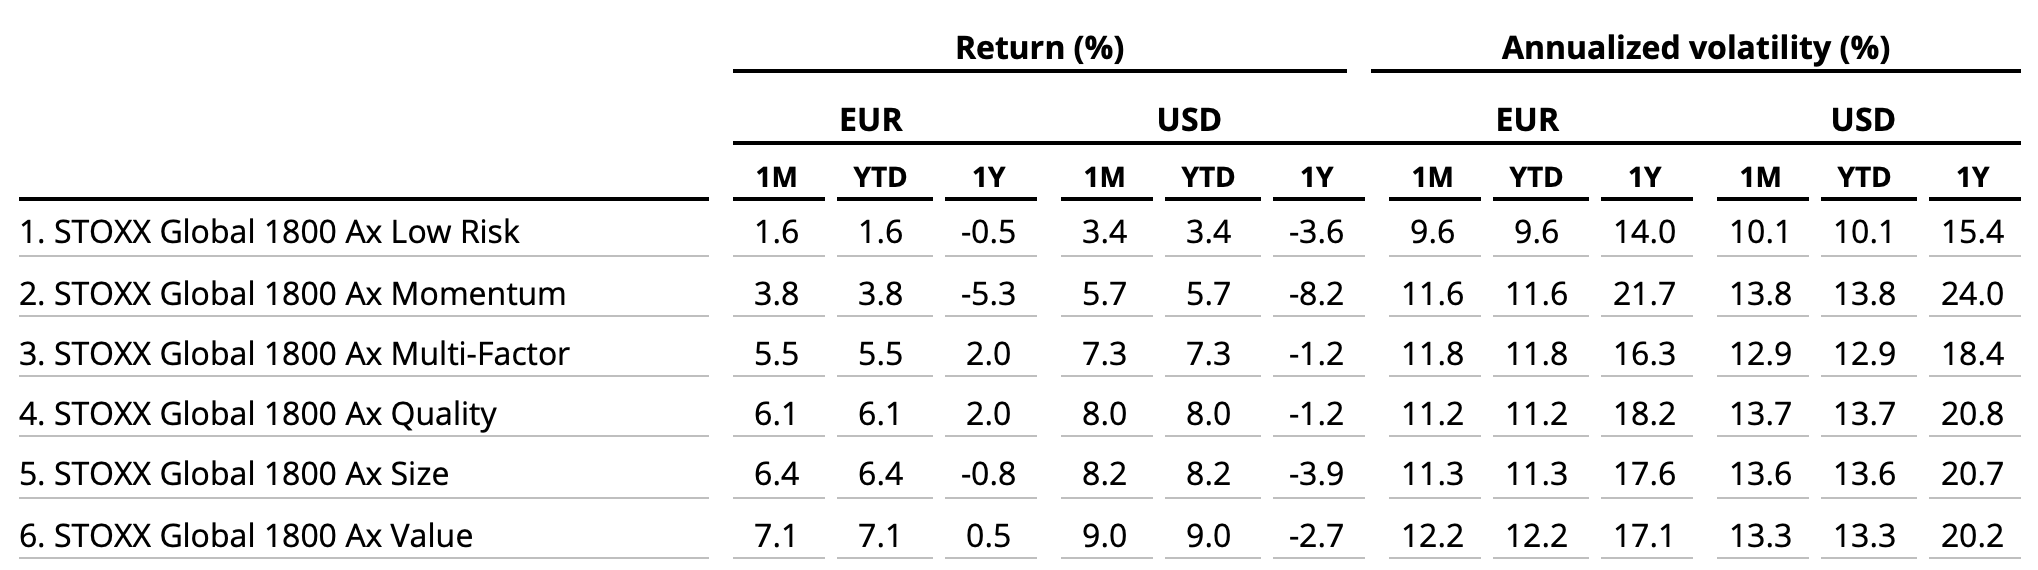
Value was the best-performing style in the month that ended, according to the STOXX Factor indices. On the other hand, investors shunned Low Risk stocks.
Figure 4: STOXX Factor (Global) indices’ January risk and return characteristics
Climate benchmarks
Among climate benchmarks, the STOXX® Global 1800 Paris-Aligned Benchmark (PAB) and the STOXX® Global 1800 Climate Transition Benchmark (CTB) gained 7.7% and 7.2%, respectively, in January. The PAB and CTB indices follow the requirements outlined by the European Commission’s climate benchmarks regulation.
The STOXX® Willis Towers Watson World Climate Transition Index also rose 7.2% in the month. The STOXX Willis Towers Watson Climate Transition Indices (CTIs) employ a unique Climate Transition Value at Risk (CTVaR) methodology that quantifies the anticipated impact of an economic transition on equity valuations. The CTIs look beyond carbon emissions and make a forward-looking, bottom-up evaluation of asset repricing risks in a decarbonization pathway.
Among the STOXX Low Carbon indices, the EURO STOXX 50® Low Carbon (+10.4%)3 outperformed the EURO STOXX 50 by 51 basis points in January. Elsewhere, the STOXX® Global Climate Change Leaders (+6.4%), which selects corporate leaders that are publicly committed to reducing their carbon footprint, lagged the STOXX Global 1800 index by 56 basis points.
Sustainability indices
The STOXX® Global 1800 ESG-X index rose 7.2% in the month. The STOXX® ESG-X indices are versions of traditional, market-capitalization-weighted benchmarks that observe standard responsible exclusions.
Within indices that combine exclusions and ESG best-in-class integration, the EURO STOXX 50® ESG index gained 10.1% in January. Germany’s DAX® 50 ESG index (+10.3%), which excludes companies involved in controversial activities and integrates ESG scoring into stock selection, outperformed the benchmark DAX.
Among other STOXX sustainability families, the STOXX® Global 1800 ESG Broad Market index climbed 7.4% in the month. The STOXX ESG Broad Market indices apply a set of compliance, product involvement and ESG performance exclusionary screens on a starting benchmark universe until only the 80% top ESG-rated constituents remain.
The STOXX® Global 1800 ESG Target gained 7.2%, the EURO STOXX® ESG Target rose 10.1% and the DAX® ESG Target added 8.7%. The STOXX and DAX ESG Target indices seek to significantly improve the benchmark portfolio’s ESG profile while mirroring its returns as closely as possible. Through a series of constraints, the indices implement an optimization process to maximize the overall ESG score of the portfolio while limiting the tracking error to the benchmark.
The STOXX® Global 1800 SRI advanced 7.6%. The STOXX SRI indices apply a rigorous set of carbon emission intensity, compliance and involvement screens, and track the best ESG performers in each industry group within a selection of STOXX benchmarks.
Finally, the DAX® ESG Screened added 9.4% in the month. The index reflects the composition of the DAX benchmark minus companies that fail to pass norms-based and controversial weapons screenings, meet minimum ESG ratings or are involved in certain business activities considered undesirable from a responsible investing perspective.
Thematic indices
After a challenging year for the STOXX® Thematic indices, the strategies set 2023 off to a promising start. Among 25 STOXX thematic indices, 20 outperformed the benchmark STOXX Global 1800 last month. Gains were led by the STOXX® Global Artificial Intelligence and the STOXX® Global Sharing Economy indices.
Dividend strategies
Most dividend strategies performed in line with their benchmarks last month. The STOXX® Global Maximum Dividend 40 (+7.7%) selects only the highest-dividend-yielding stocks. The STOXX® Global Select Dividend 100 (+7%) tracks companies with sizeable dividends but also applies a quality filter such as a history of stable payments.
Minimum variance
Minimum variance strategies underperformed benchmarks by a wide margin last month. The STOXX®Global 1800 Minimum Variance added 3.2% and the STOXX® Global 1800 Minimum Variance Unconstrained rose only 2.6%.
The STOXX Minimum Variance Indices come in two versions. A constrained version has similar exposure to its market-capitalization-weighted benchmark but with lower risk. The unconstrained version, on the other hand, has more freedom to fulfill its minimum variance mandate within the same universe of stocks.
1 All results are total returns before taxes unless specified.
2 Throughout the article, all European indices are quoted in euros, while global, North America, US, Japan and Asia/Pacific indices are in dollars.
3 Figures in parentheses show last month’s gross returns.


