

Stocks tumbled last month, posting their weakest showing since March 2020 and the worst January since 2016, as investors assessed the potential impact of higher US interest rates.
The STOXX® Global 1800 index dropped 5.5% during last month when measured in dollars and including dividends.1 The index retreated 4.1% in euros as the greenback strengthened 1.4% against the common currency.
The pan-European STOXX® Europe 600 index lost 3.8% in euros from a record during the month, while the Eurozone’s EURO STOXX 50® index decreased 2.7%.2 The STOXX® North America 600 index slid 5.6% in dollars and the STOXX® Asia/Pacific 600 index shed 5.3%.
Figure 1: Benchmark indices’ January risk and return characteristics
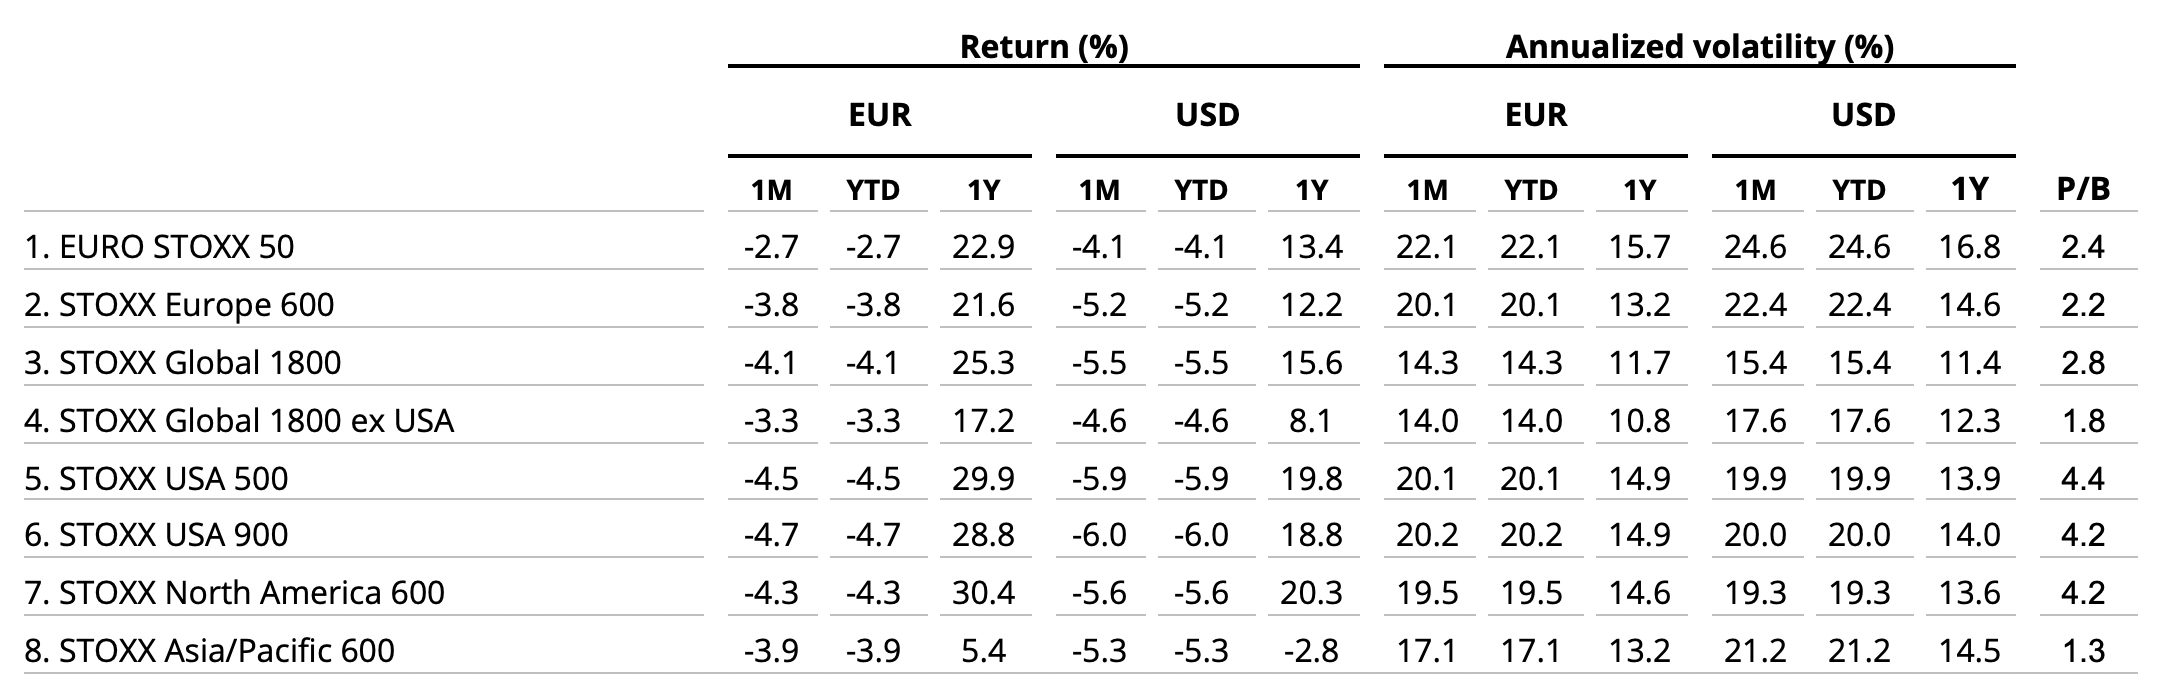
| For a complete review of all indices’ performance last month, visit our January index newsletter. |
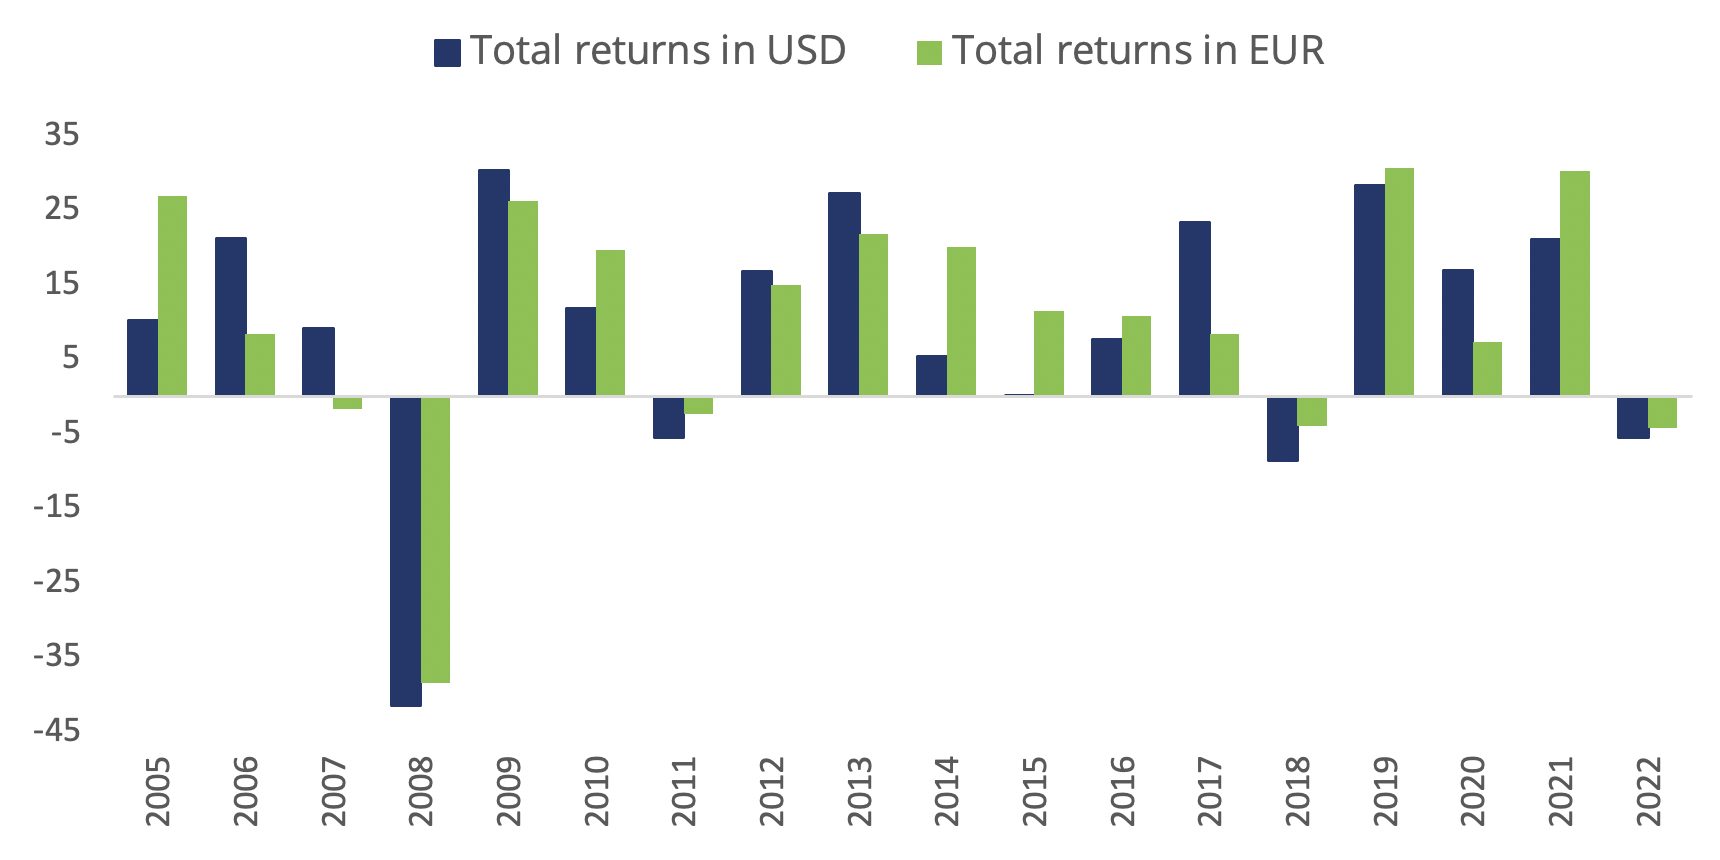
The STOXX Global 1800 posted in 2021 its third consecutive double-digit annual advance and has now gained in nine of the past ten years. Returns have amounted to an average of 13.9% per year over the last decade.
Speaking before the Senate on January 12, Federal Reserve Chairman Jerome Powell said the bank will likely tighten monetary policy this year amid a growing economy and runaway inflation. On January 26, the central bank chief suggested during a press conference that the first interest-rate hike since 2018 may come in March and would be followed by others.3
Figure 2: Annual % returns for STOXX Global 1800 index
Rising borrowing costs were not the only concern investors have had to contend with. Ongoing disruption to businesses caused by the COVID-19 pandemic and the threat of a Russian invasion of Ukraine also weighed on share prices. While some companies including Apple Inc. beat earnings expectations, corporate financial updates in January were more mixed than in previous quarters.
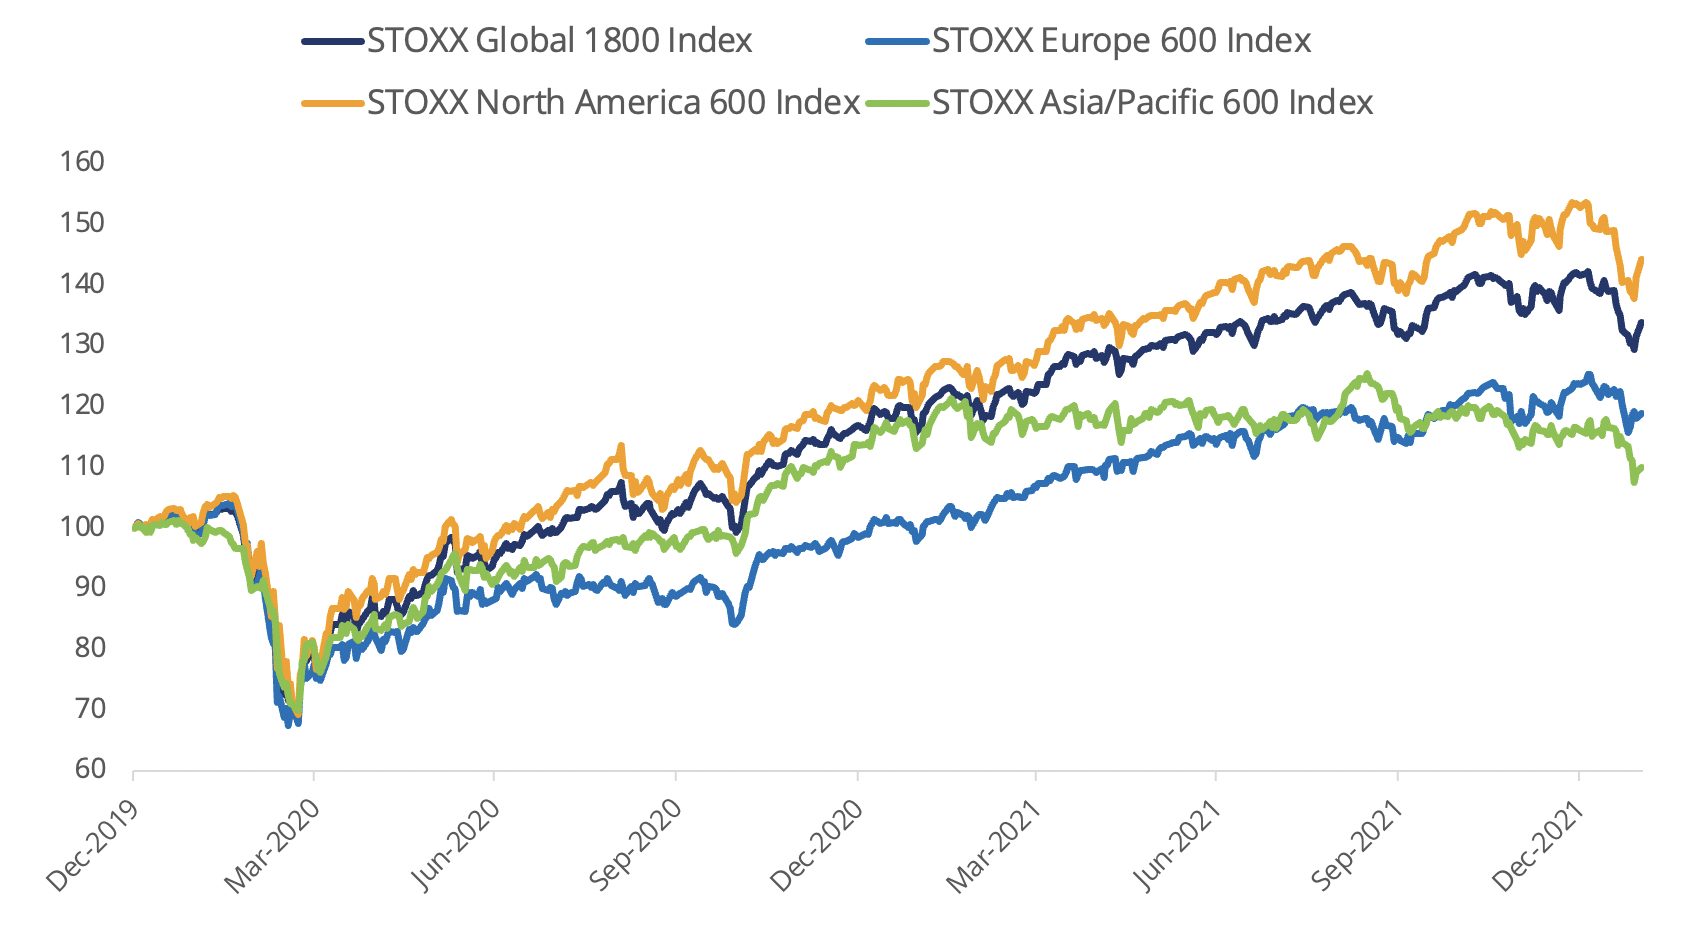
Figure 3: Returns since January 1, 2020
Volatility jumps
The EURO STOXX 50® Volatility (VSTOXX®), which tracks EURO STOXX 50 options prices, spiked to 27 at the end of last month from 19.3 in December. A higher VSTOXX reading suggests investors are paying up for puts that offer insurance against stock price drops. The index climbed to 86 in March 2020 as governments restricted work and social activities.
The VDAX-New®, which tracks volatility in German equities, rose to 26 from 17.7 in December.
Developed and emerging markets
All but two — Singapore and Canada — of 25 developed markets tracked by STOXX fell during January when measured in dollars. The STOXX® Developed Markets 2400 index dropped 5.6% in dollars and 4.3% in euros.
Emerging markets performed better. Eleven of 21 national developing markets rose in the month on a dollar basis. The STOXX® Emerging Markets 1500 index declined 2.1% in the US currency and 0.6% in euros.
Energy shares jump
All but three of 20 Supersectors in the STOXX Global 1800 retreated in the month. The STOXX® Global 1800 Media (-14.3%)4 yielded the worst return. At the other end, the STOXX® Global 1800 Energy index rose 13.6%.
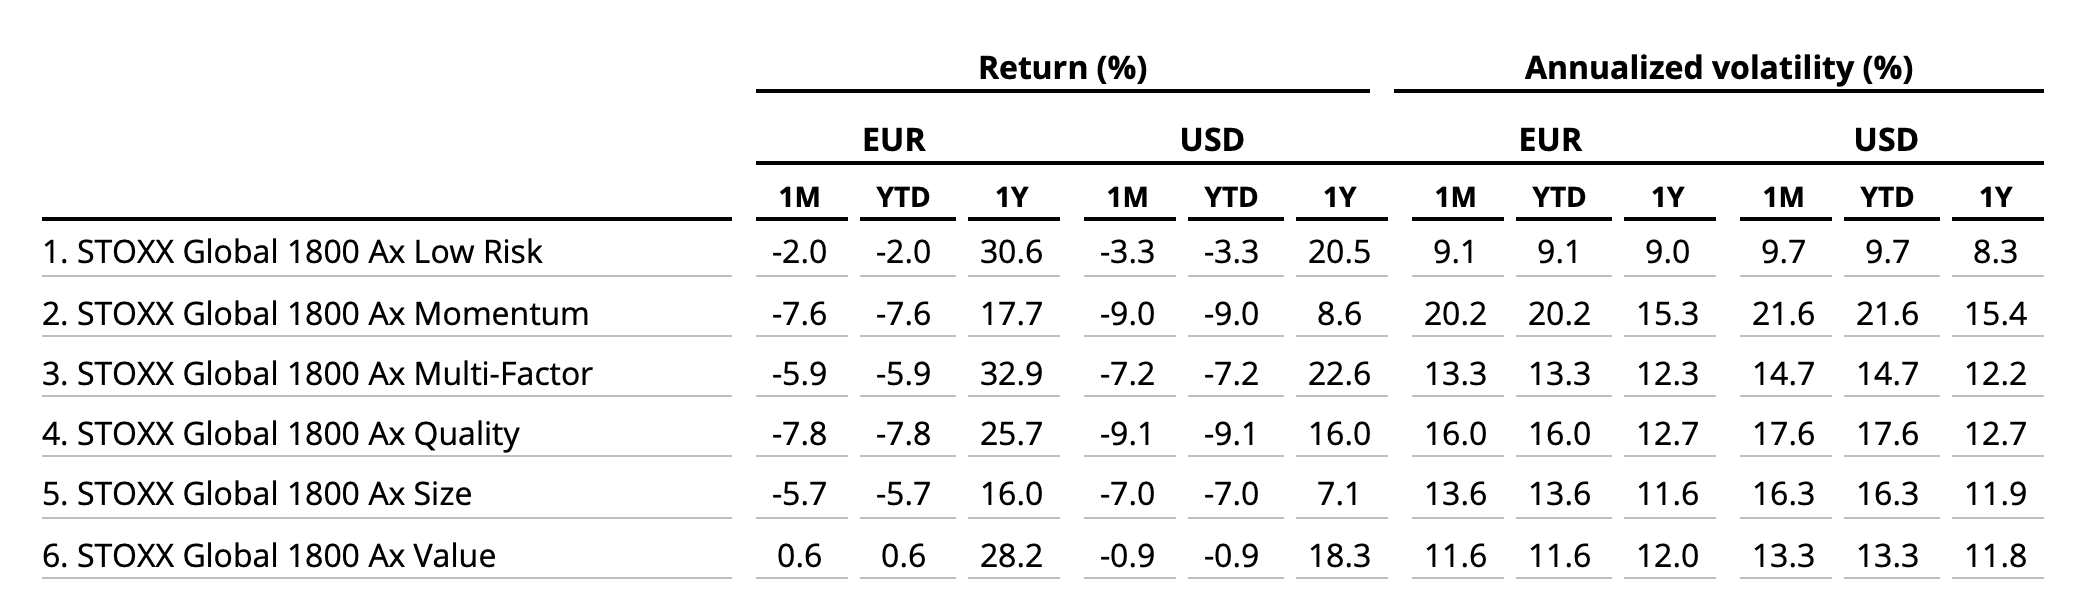
Momentum, Quality take hit while Value outperforms
January’s sell-off was led by those stocks that had seen the steepest gains in recent years, according to the STOXX Factor indices, particularly growth-style US shares in the consumer discretionary and technology industries, but also high-quality stocks. The STOXX® Global 1800 Ax Momentum, which tracks those companies with the best market performance over the preceding months, fell 9% in January, its worst monthly showing since the pandemic hit in March 2020. The STOXX® Global 1800 Ax Quality dropped 9.1%.
On the other hand, so-called Value stocks held up reasonably well as investors focused the selling on overbought, overpriced shares. The STOXX® Global 1800 Ax Value lost only 0.9% during the month.
Figure 4: STOXX Factor (Global) indices’ January risk and return characteristics
ESG-X and ESG indices
The STOXX® Global 1800 ESG-X index dropped 5.8%. The STOXX® ESG-X indices are versions of traditional, market-capitalization-weighted benchmarks that observe standard responsible exclusions of leading asset owners.
Within indices that combine exclusions and ESG nest-in-class integration, the EURO STOXX 50® ESG index beat its benchmark by 25 basis points during January, taking the outperformance in the past year to 3.2 percentage points. Germany’s DAX® 50 ESG index (-1.8%), which excludes companies involved in controversial activities and integrates ESG scoring into stock selection, outperformed the benchmark DAX® (-2.6%) in January.
Sustainability indices
Among other STOXX sustainability families, the STOXX® Global 1800 ESG Broad Market index declined 5.6% in January. The STOXX ESG Broad Market indices apply a set of compliance, product involvement and ESG performance exclusionary screens on a starting benchmark universe until only the 80% top ESG-rated constituents remain.
Next, the STOXX® Global 1800 ESG Target lost 5.2%, the EURO STOXX® ESG Target fell 3.5% and theDAX® ESG Target dropped 2.8%. The STOXX and DAX ESG Target indices seek to significantly improve the benchmark portfolio’s ESG profile while mirroring its returns as closely as possible. The indices implement, through a series of constraints, an optimization process to maximize the overall ESG score of the portfolio while constraining the tracking error to the benchmark.
Finally, the STOXX® Global 1800 SRI slipped 5.3%. The STOXX SRI indices apply a rigorous set of carbon emission intensity, compliance and involvement screens, and track the best ESG performers in each industry group within a selection of STOXX benchmarks.
Climate benchmarks
The STOXX Paris-Aligned Benchmark indices (PABs) came behind their benchmarks in the month that ended, with the STOXX® Global 1800 PAB index falling 6.2%. The PAB indices follow the requirements outlined by the European Commission’s Technical Expert Group (TEG) on climate benchmarks.
The STOXX® Willis Towers Watson World Climate Transition Index declined 6.8% in January. The STOXX Willis Towers Watson Climate Transition Indices (CTIs) were introduced in October 2021. They employ a unique Climate Transition Value at Risk (CTVaR) methodology that quantifies the anticipated impact of an economic transition on equity valuations. The CTIs look beyond carbon emissions and make a forward-looking, bottom-up evaluation of asset repricing risks in a decarbonization pathway.
Among the STOXX Low Carbon indices, the EURO STOXX 50® Low Carbon (-2.4%) beat the EURO STOXX 50 by 33 basis points. Elsewhere, the STOXX® Global Climate Change Leaders (-4.2%), which selects corporate leaders that are publicly committed to reducing their carbon footprint, returned 1.3 percentage points more than the STOXX Global 1800 index last month. The Climate Change Leaders index outperformed by 4.7 percentage points in 2021.
Thematic indices
It was a difficult month for thematic investing, with all but one of 22 revenue-based STOXX® Thematic indices trailing the STOXX Global 1800 index. The exception was the STOXX® Global Broad Infrastructure (-2.7%). The STOXX® Global Breakthrough Healthcare was the worst performer in the month after shedding 14.8%.
The STOXX Thematic indices seek exposure to the economic upside of disruptive global megatrends and follow two approaches: revenue-based and artificial-intelligence-driven.
Among the STOXX artificial-intelligence-driven thematic indices, the iSTOXX® Yewno Developed Markets Blockchain index (-2.4%) posted a narrower loss than the benchmark’s.
Dividend strategies
Dividend strategies had positive returns in the month that ended. The STOXX® Global Maximum Dividend 40 (2.2%) selects only the highest-dividend-yielding stocks. The STOXX® Global Select Dividend 100 (0.8%), meanwhile, tracks companies with sizeable dividends but also applies a quality filter such as a history of stable payments.
Minimum variance
There were mixed performances from Minimum variance strategies last month, relative to benchmarks. The STOXX® Global 1800 Minimum Variance fell 5.5% and the STOXX® Global 1800 Minimum Variance Unconstrained declined 2.3%. The STOXX® Europe 600 Minimum Variance index lost 6.1%, while its unconstrained version fell 4.7%.
The STOXX Minimum Variance Indices come in two versions. A constrained version has similar exposure to its market-capitalization-weighted benchmark but with lower risk. The unconstrained version, on the other hand, has more freedom to fulfill its minimum variance mandate within the same universe of stocks.
1 All results are total returns before taxes unless specified.
2 Throughout the article, all European indices are quoted in euros, while global, North America, US, Japan and Asia/Pacific indices are in dollars.
3 Reuters, ‘Fed likely to hike rates in March as Powell vows sustained inflation fight,’ January 26, 2022.
4 Figures in parentheses show last month’s gross returns.


