The first quarter of 2020 has concluded in a profoundly different world, leaving implications for society, well-being and investing. Through the COVID-19 crisis, global factor indices delivered some solace for investors — namely outperformance in defensive (Quality, Low Risk) and Multi-Factor strategies. Continued pain in factors such as Size and Value, however, highlighted the headwinds still facing factor investors.
As we’ve written with regards to the current drawdown, a long-term perspective matters. And our core belief that underlies the construction of the STOXX Factor Indices is that portfolio construction matters. The recent volatility gives us a new opportunity to assess the impact of this philosophy. To that end, for our review of Q1 2020, we will focus on performance and three other areas: diversification, liquidity and return sources.
Performance
Starting with performance, Chart 1 shows the cumulative active returns (i.e. returns in excess of the benchmark) for the quarter, broken down into pre- and post-Feb. 19, 2020, the day that marked the peak before the virus-driven downturn.
Chart 1
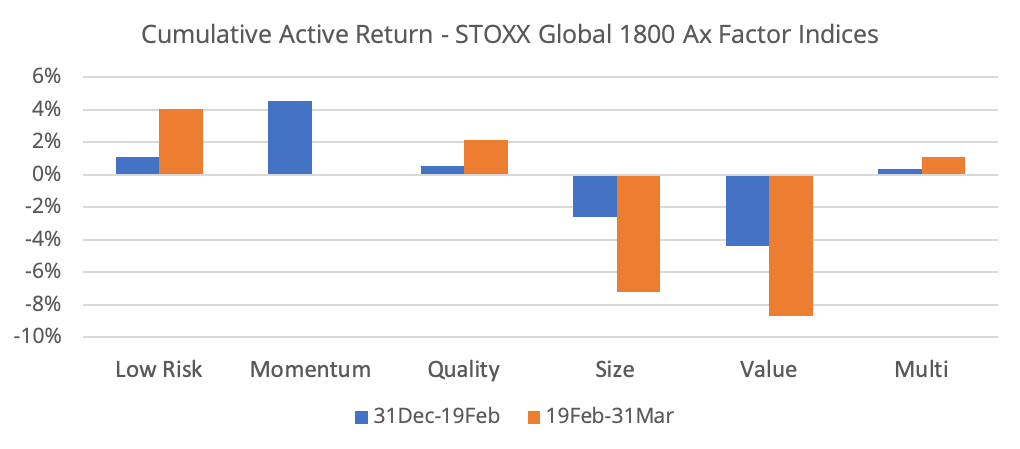
Sources of out/underperformance will be explored later in this post, but we observe some results that match intuition. The more defensive factors (Low Risk and Quality) had the strongest post-crisis returns. On the other hand, ‘riskier’ factors, such as Value and Size, had significant drawdowns.
For a detailed discussion of how this compares to the global financial crisis, see two recent publications: one using alphas to sort winners and losers, and another one looking at factor valuations, to assess where we are in terms of a risk recovery.
Diversification
The lack of diversification across asset classes during the COVID-19 crisis occurred when it was needed by investors the most. In the factor space, diversification amongst single factors is a key part of their utility — and indeed, the diversification benefit among single factor indices has generally increased (i.e. 1-year correlations became closer to 0) since the start of the crisis.
Chart 2 shows average pairwise correlations between the STOXX global single factor indices, using daily returns for a rolling 1-year period. In addition, and to illustrate the impact of unintended exposures on correlations, we include test versions of the STOXX indices without constraints on unintended style factor exposure.
Chart 2
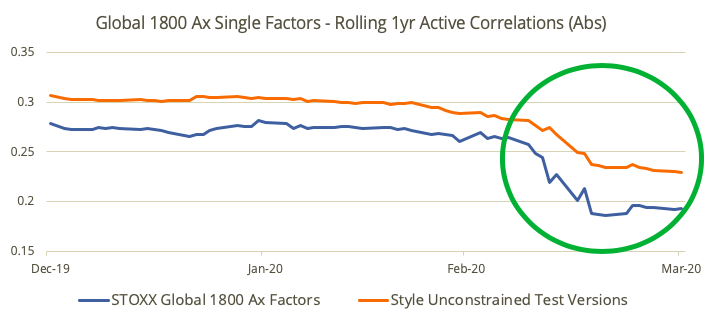
Since the start of the crisis, some of the biggest ‘gains’ (i.e. moves closer to 0) in cross-factor correlations were in the Momentum pairs (vs. Quality, Size, Value). We also observe that without the style constraints (STOXX single factor indices constrain non-targeted factors from Axioma Factor Risk Models), the correlation between factors would still have decreased, but not to the same extent. Note that this data represents just the single factors — the Multi-Factor index uses an integrated approach that seeks securities with strong factor exposure on an aggregate basis.
Liquidity
With the potential for factor strategies to ‘load up’ on smaller, less liquid stocks with attractive factor profiles, ensuring tradability is an important objective for a factor index, especially in times of crisis. To gauge how the liquidity of the index has evolved at a high level, we create a hypothetical $10-billion allocation to the STOXX Global 1800 Ax Multi-Factor Index. For the purpose of this illustration, we define liquidity as a ratio of position size in this portfolio to 60-day Median Daily Volume. This is the same data point used for the ‘Weighted Days to Trade’ constraint in the minimum variance and factor indices. To assess the impact of the liquidity-focused elements of the methodology, we also include a test version where we remove liquidity and weight diversification constraints.
Chart 3
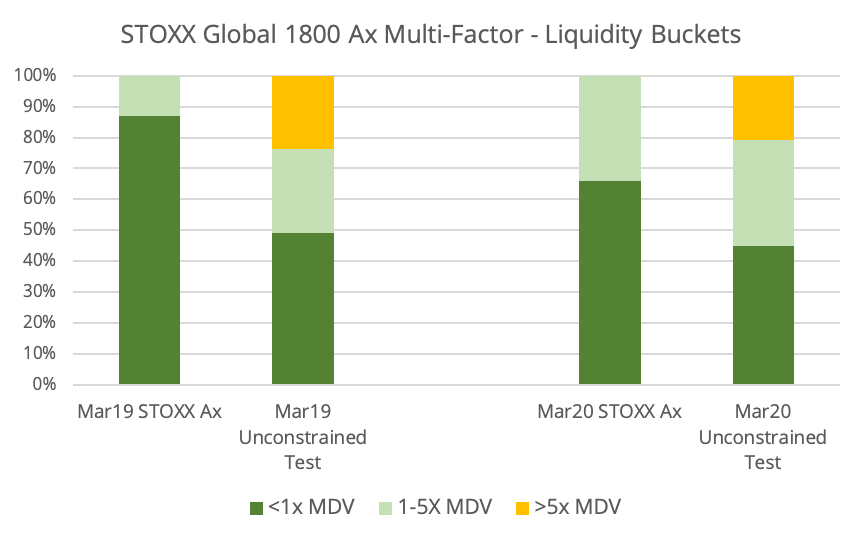
We observe that versus one year ago, the portion of the theoretical, constant $10-billion portfolio in the higher liquidity bucket decreased, though the bulk of the portfolio weight remains there. We also observe that without the constraints to ensure maximum position sizes and liquidity, a substantial portion of the portfolio would be in the worst liquidity bucket, which is avoided in the official STOXX version.
Return sources
While intended vs. unintended factor exposures can have an impact on cross-factor correlations, they will naturally also impact performance outcomes. For this section, we turn to the US and use the robust factor exchange-traded fund (ETF) landscape as a basis for comparison. For each factor, we look at average style exposure across a selection of popular ETFs, as well as corresponding performance attributions during the quarter. For simplicity, we use the Axioma United States Equity Factor Risk Model (AXUS4) and the STOXX® USA 900 Index as a benchmark across the board.
Starting with exposures, we look at the difference between intended and unintended daily style factor exposures across the quarter. We define intended exposures using our mapping of factors to the Axioma Factor Risk Model — this is the same data that can be found daily on Qontigo Factor iQ.
Chart 4
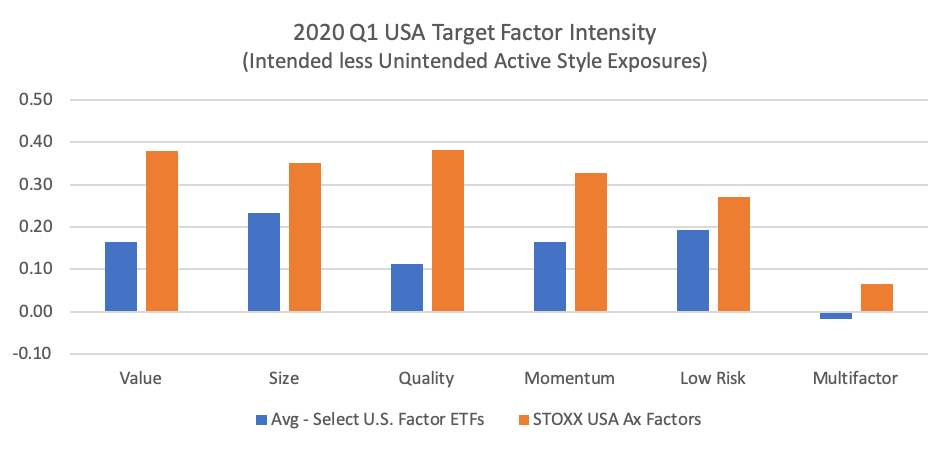
The average select ETF exhibited reasonable exposure to intended factors (vs. unintended) throughout the volatile quarter, although the intensities varied across factors. For the STOXX indices, the intensity of the intended factor exposures was (by design) strong across the factors. Given the number of targeted factors in the Multi-Factor strategy, the difference is more muted.
Turning to attribution, we look at how these exposures translate to active performance. In Chart 5, the return is broken down into the intended style factor exposure (the darker bars), and everything else (which can include industry exposure, unintended style exposure and specific risk, or unexplained exposure).
Chart 5
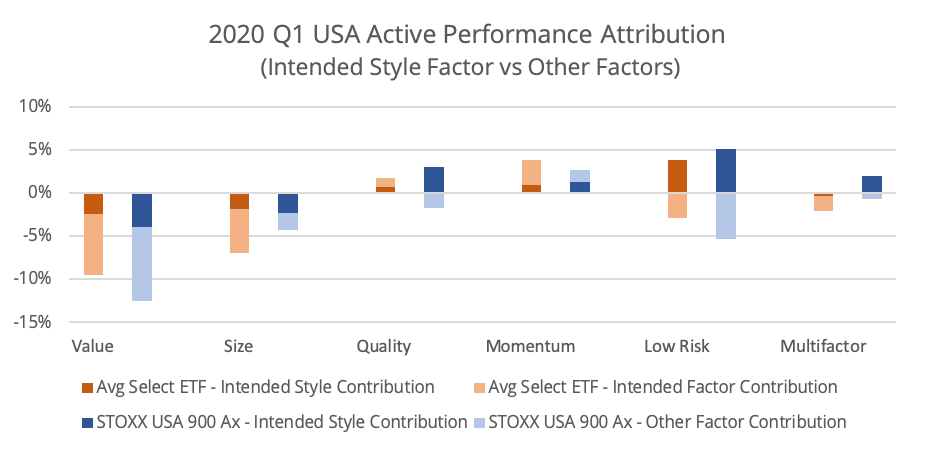
We observe much more of a ‘mixed bag’ here, both in terms of overall performance and in the dominance of the intended style factor. Some suboptimal outcomes appear, such as Value having not only a negative contribution from the targeted style, but also from unintended sources such as market sensitivity and specific returns. This was not, however, an isolated occurrence in the market. On the other hand, we observe Quality’s positive return and dominance of the intended style factor exposure.
Conclusion
During a historically difficult Q1, including for equity beta, factor indices saw some positive stories — defensive and multi-factor outperformance — along with some continued pain in factors such as value. As we wrote recently, if history is a guide, we could potentially see strong factor performance return soon. Investors have increasing choices on how to capture that performance — the STOXX factor indices were designed to be driven by targeted exposures and liquid securities. The recent crisis has highlighted the importance of these objectives more than ever.
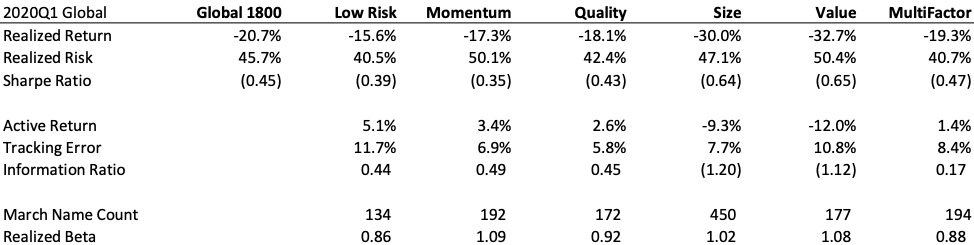
Q1 2020 Global Summary Performance